AI & Data Storytelling: A Practical Guide
This is the second lecture in a ten-module email course to teach creators, marketers, analysts, and journalists how to use AI to build data-driven stories—faster, smarter, and more creatively.
Learning Objectives
- Understand how to speed up your data analysis using AI
- Learn different AI tools you can use to conduct data analysis
- Understand where you may still need to conduct a manual data analysis
Introduction
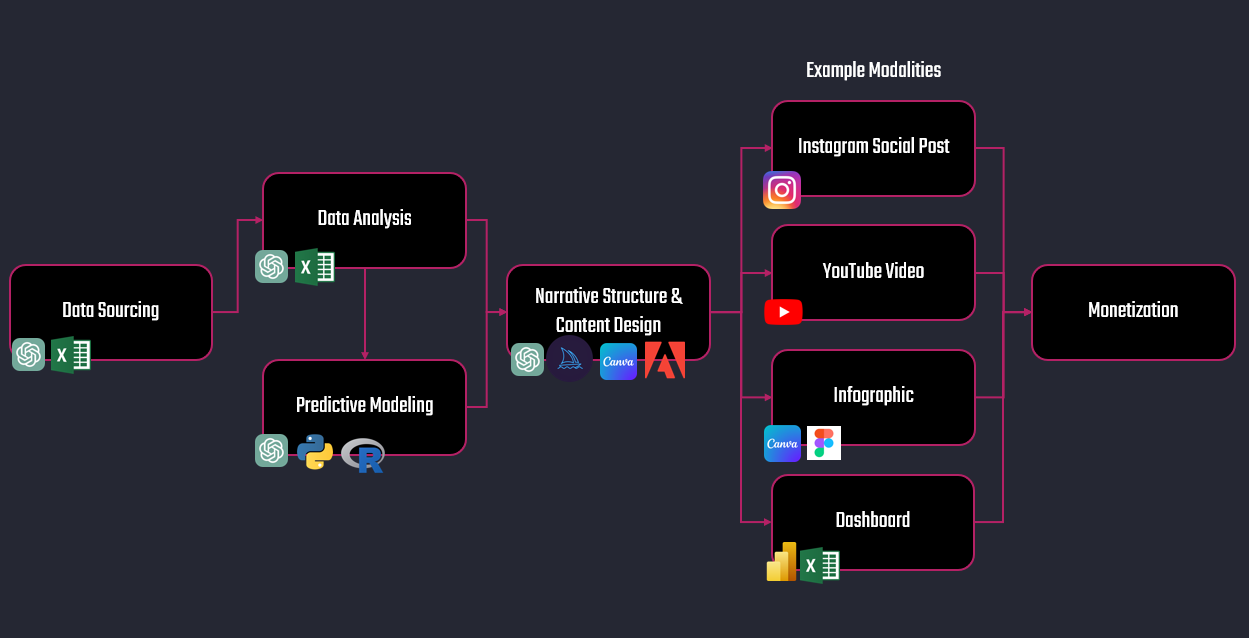
In the first module of this course, we introduced you to the Data Storytelling lifecycle, which you can see below. Traditionally, it can take a lot of time to manage your data analysis. In fact, you might find this to be your most time-consuming part of the data story project. So, this week we wanted to explore different ways that you can fast track and automate your data analysis using AI.
While the landscape of AI tools is growing, we'll test ChatGPT and Microsoft's Copilot and explore how you can transform the way you uncover insights, build visuals, and tell impactful data stories.
Whether you're a sports analyst, journalist, content creator, or student, learning how to automate your data analysis can save hours of work and surface trends that would be hard to spot manually. Further, AI gives you access to a world of expertise that you may not have, so building predictive models is much closer at hand that in previous years.
In this article, we’ll walk through how to use AI to turn real-world soccer stats from the NWSL into an engaging and insightful story — in minutes, not hours.
Short on time? Check out our quick-hit tutorial below.
Conducting a Data Analysis Manually
For this example, we chose women's soccer. The sport is on the rise, and the availability of clean data sources or APIs is not as pervasive as men's football – so getting data is a bit more challenging and therein lies the fun.
In the data storytelling lifecycle, Data Sourcing precedes Data Analysis, and we used FB Ref as the data source for this test. We copied the Standard Player Stats table into a Microsoft Excel spreadsheet and started from there. The resulting table has 310 rows (player entries) and 34 columns (comprising player metadata and performance statistics).
You can find the raw NWSL dataset (sourced from FB Ref) here.
Shaping the Test with Three Questions
Three questions will guide our sample analysis:
- Who are the top ten point getters in the league?
- Who are the top five over-performing players (using goals scored versus expected goals)?
- Who are the five most balanced point producers (using n goals and assists)?
To answer these questions, we:
- Formatted the dataset as a table and cleaned up the data.
- Added calculated columns that would be useful (e.g., Goals per Game, Assists per Game, etc.).
- Created a PivotTable to help answer the above questions.
Who are the top ten point getters in the league?
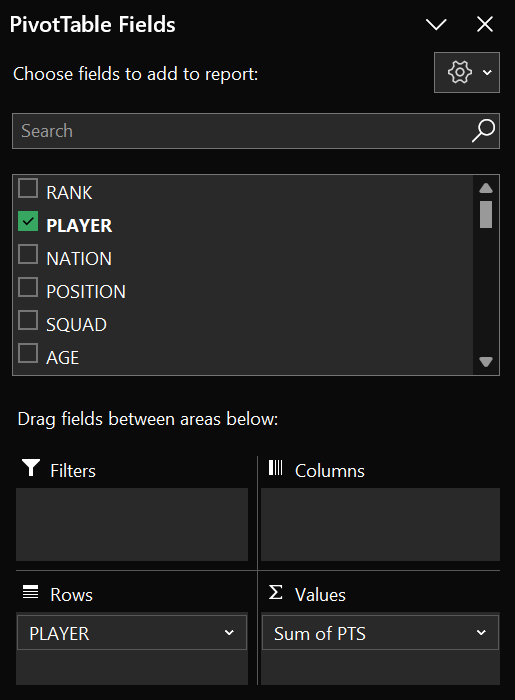
Within the PivotTable, use PLAYER and PTS in the Rows and Values fields, respectively.
Copy and paste the data into a new tab, format the table and sort in descending order. Here are the top ten players by points – though we're leaving two players off who also scored 6 points.
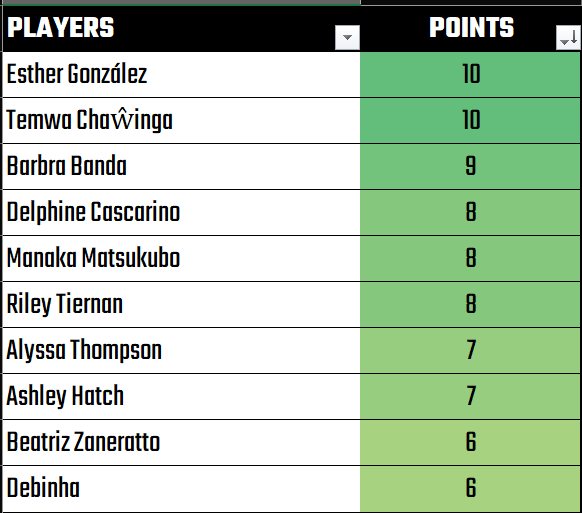
Answering this question was easy. There was no need for calculated columns; we just used what came with the FB Ref dataset.
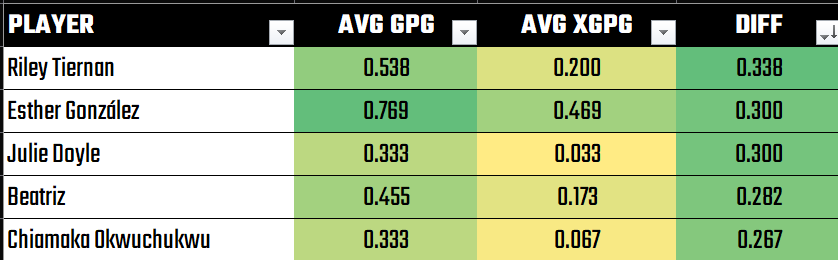
Who are the top five over-performing players?
To answer this question, we'll return to the PivotTable, but this time use PLAYER, GPG and XGPG for the pivot. Both GPG and XGPG are calculated columns (G / MP and XG / MP) to get the game-level actual and expected goals for each player. The DIFF is the difference between the actual goals and the expected goals, and sorting in descending order gets you the player that is over-performing the most.
Thus, these are the top five players that are over-performing based on our calculated columns.
Who are the five most balanced point producers?
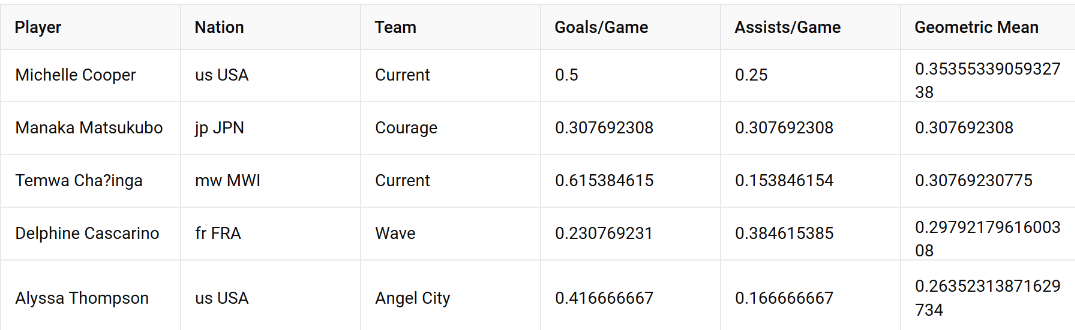
There are different ways to calculate "balance", but we wanted something simple and easily ranked. So, we used the geometric mean between GPG and APG, which is calculated at the game level. We've noted this in the BALANCE column.
You get the top balanced players by sorting in descending order by the BALANCE column, which results in the following five players.
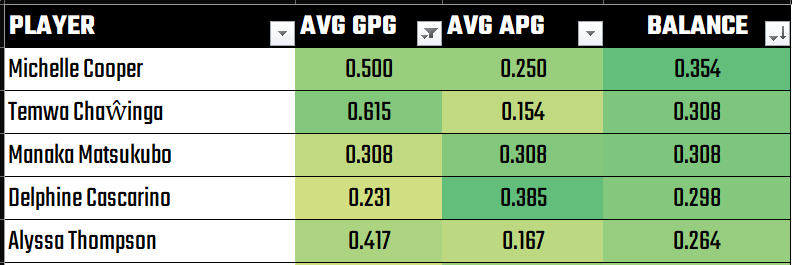
What's interesting is that not all of these players are in the top ten point producers. For example, Michelle Cooper is ranked 12th for point getters in the league.
Summary of Effort
By conducting the data analysis manually, we divided our time as follows:
- An hour-ish to source, clean and transform the data (which includes the calculated columns) and do some remedial reporting (e.g., heatmaps).
- Another thirty minutes to create the PivotTable and then create separate tabs for each of the questions with clean reports/heatmaps and then review the findings.
We're proficient in Excel (everything was done in Excel) and have a good understanding of different sports stats and how we might arrive at calculations. So, you may need more or less time to work through the test.
Join Data Punk Media today to learn more about how to analyze sports data and predict the next breakout soccer player.
Automating Your Analysis using AI
Let's now take this same dataset and run it through different AI tools to see if there's a time saving (and if AI augments the results with additional information, questions to answer, patterns, etc.). We're going to use the dataset with the calculated columns, so we have the same base dataset for each of the below.
ChatGPT
Let's explore answering each question using ChatGPT.
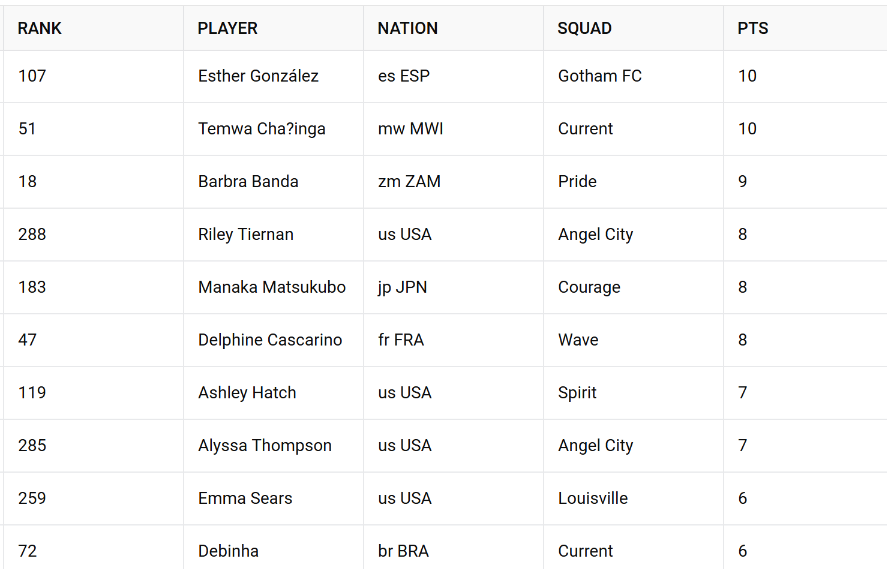
Who are the top ten point getters in the league?
Open a new ChatGPT session and type in a prompt similar to the following. Note that we're giving ChatGPT very specific information, but we've observed it being able to discern what the individual columns mean.
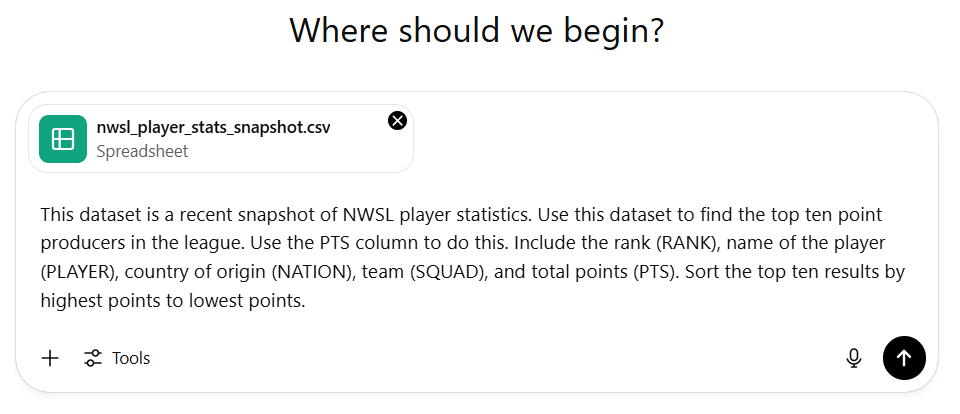
The results are quick and to spec. You can also download the results into a CSV file that you can use offline
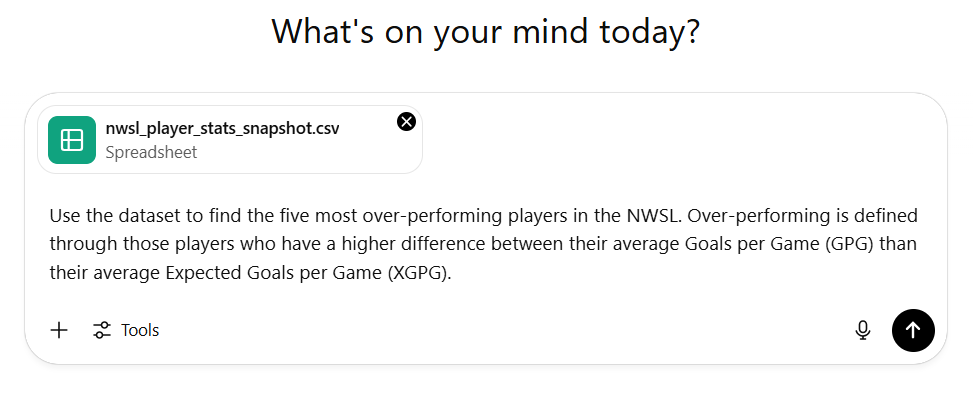
Who are the top five over-performing players?
For this one, we'll follow a similar workflow and enter the following prompt.
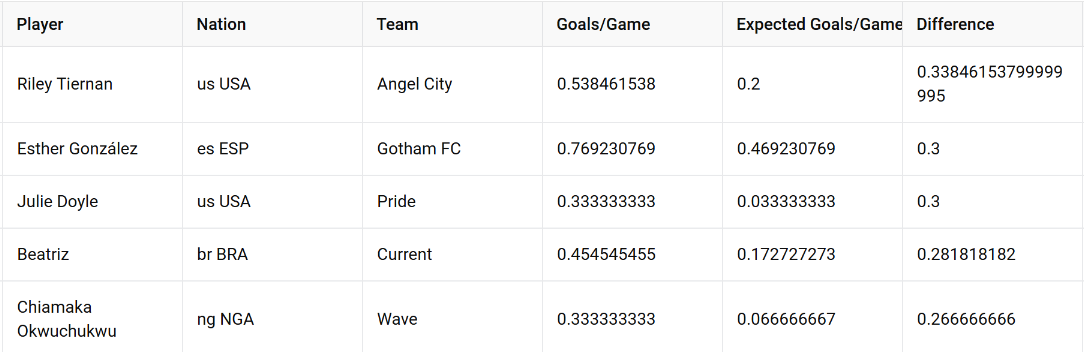
ChatGPT is able to quickly return the results for us, again providing a downloadable CSV for us to use offline.
Who are the five most balanced point producers?
Let's be more vague with this next one to see what comes of it.

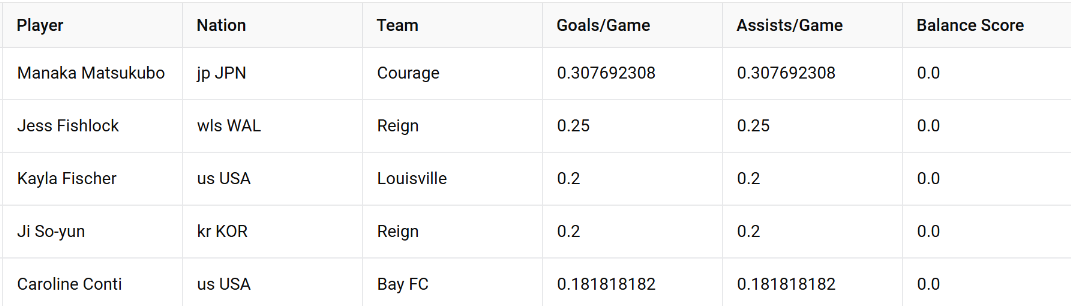
Here, the results are interesting. ChatGPT interprets "balanced" as resulting in zero when taking the difference between GPG and APG.
So, we tried one more time using the following adjusted prompt.
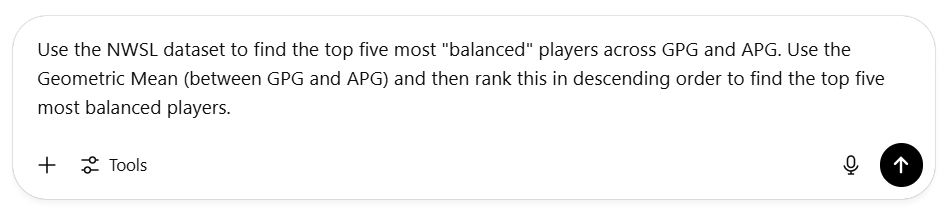
These results are better.
All told, with a clean dataset and a few prompts, we were able to get the same results in a fraction of the time. You still need to clean and prep the data, but once you've done this ChatGPT (with some specific prompts) can analyze your data quickly.
Subscribe today to be the first to access our stories! The past releases can be accessed here.
Microsoft Copilot
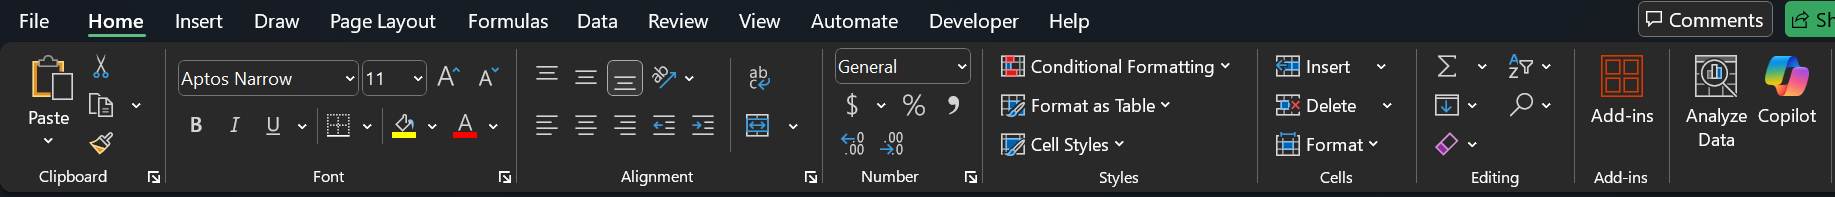
You can find the Microsoft Copilot button on the Home tab in Excel towards the extreme right of the tab.
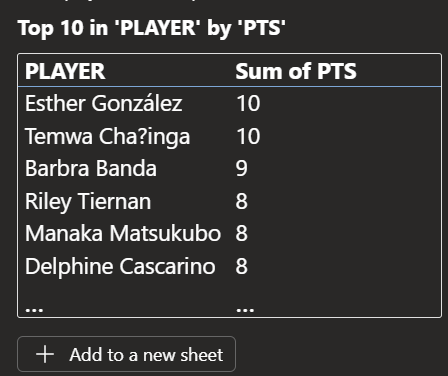
Microsoft Copilot operates similarly to ChatGPT and allows you to prompt your way to various reports – though there's more integration with Microsoft products. For example, we submitted the first question in the Copilot task pane.

You get an abbreviated view of the results in the task pane, which you can copy into a new Excel sheet.
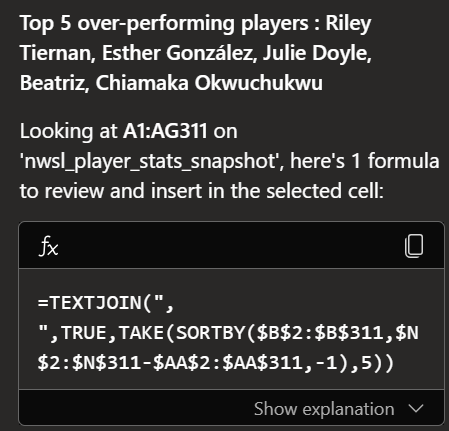
We moved on to the second question and provided a similar prompt to ChatGPT.
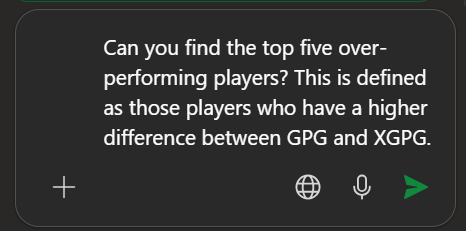
The results, though, were interesting because we got the results and Copilot provided us with a reusable script to embed into the Excel spreadsheet.
We entered the third prompt into Copilot, again similar to how we had done in ChatGPT.
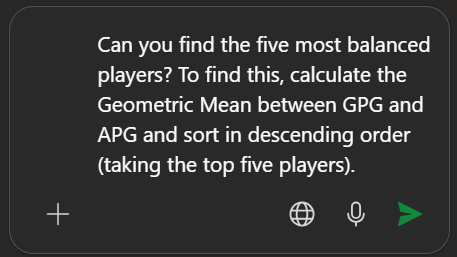
With this prompt, Copilot struggled to get the answer correct. To remedy the situation, we had to add a calculated column (that calculated the geometric mean between GPG and APG) and then use that in an updated prompt.
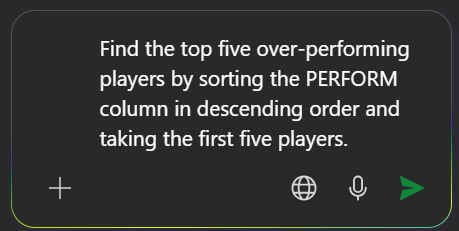
However, in the same amount of time we spent typing in the prompt, we could have sorted the table in descending order (using the PERFORM column) ourselves and found the answer.
Summary of Effort
By conducting the data analysis using AI, we observed a much quicker time-to-analysis (especially when our prompts were specific to our needs). Now, it's important to note that we started after sourcing the data. While AI can help you some, a predictable data pipeline for your data analysis and modeling still requires data modeling, cleaning and transformation techniques.
Further, AI can help you in your data exploration. For example, we've been using ChatGPT to help us in our initial exploratory data analyses. This helps us find outliers, get a sense for the shape of the data, find patterns and trends, etc. Again, it doesn't replace the analysis effort; ChatGPT becomes our analytical assistant.
Join Data Punk Media today and explore the different data stories we publish.
Summary
In this lecture, we took a sample of NWSL player performance data and structured a test analysis using three questions:
- Who are the top ten point getters in the league?
- Who are the top five over-performing players (using goals scored versus expected goals)?
- Who are the five most balanced point producers (using n goals and assists)?
We then conducted a data analysis manually using Microsoft Excel, and then we used ChatGPT and Microsoft Copilot to run the analysis using AI.
We saw gains in time for the analysis using ChatGPT, which also understood some of the nuances of the soccer statistics. For this test, Microsoft Copilot was good for the first two questions, but then struggled with the third. We did like the suggested DAX scripts that you can then insert into your spreadsheet.