Within the Numbers Series # 3
Introduction
Scoring dominates the conversation in hockey. It’s the cleanest signal, the easiest stat to understand, and the one most often used to define greatness. But if you’ve spent any time analyzing the game, then you know that goals and points are just the visible layer. Underneath that layer is something more important: control.
This week’s data story starts with a simple question: Who is driving the game at both ends of the ice in the PWHL? Not just scoring, but influencing outcomes—offensively and defensively—on every shift.
To explore that, we built a composite metric called the Two-Way Impact Score (TWIS). The idea is simple: hockey is played at both ends of the ice, so a meaningful evaluation of performance should reflect that. TWIS combines offensive contributions, like shots and point production, with defensive indicators such as blocks, physical play, and overall disruption. The goal isn’t to replace traditional stats, but to extend them into something more complete.
For data analysts and creators, this is where the story begins. Not with the metric itself, but with the why. TWIS exists because a gap exists. Traditional hockey analysis tends to overweight offense because it’s easier to measure and easier to communicate. But the data—and the game—suggest that this creates blind spots. So the first storytelling layer here is simple: we’re trying to measure what’s missing.
Feeling lazy and don't want to read? Then check out our quick-hit video below.
League Breakout of TWIS
After we calculated TWIS across all players, the next step isn’t to jump straight into rankings. Instead, we zoomed out and looked at distribution. To do this, we broke the players into quartiles (Q1 through Q4) to understand how two-way impact is spread across the league – and the differences across each quartile. Per the visualization below, you can see how the average TWIS is distributed across the league.
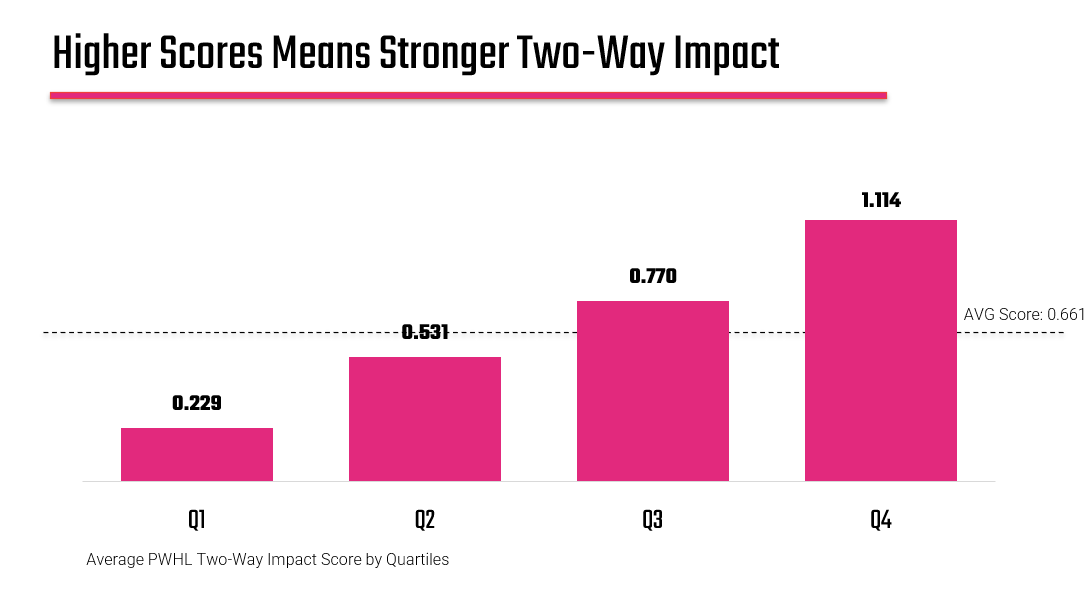
What we see is that not all players are built the same. The top quartile (Q4) contains players who consistently play at both ends of the ice. These are your true two-way drivers. At the lower end (Q1), you find more specialized or role-based players—those who may contribute in specific situations but don’t consistently influence the full flow of the game. This isn’t a value judgment; it’s a structural insight. Teams need both types. But from a storytelling perspective, it creates a clear segmentation: complete players vs specialized players.
Interested in taking one of our live workshops on Sports, AI and Storytelling? Then check out our Offerings page.
TWIS Versus Point Production
Player segmentation sets up the next layer of the story: does two-way play actually matter for production? In other words, is this just a nice theoretical concept, or does it show up in results?
To answer that, we plotted TWIS against point production for all skaters. The result is a moderate positive correlation—around 60%. This is where things get interesting. The relationship is real, but it’s not perfect. And that imperfection is where the story lives.
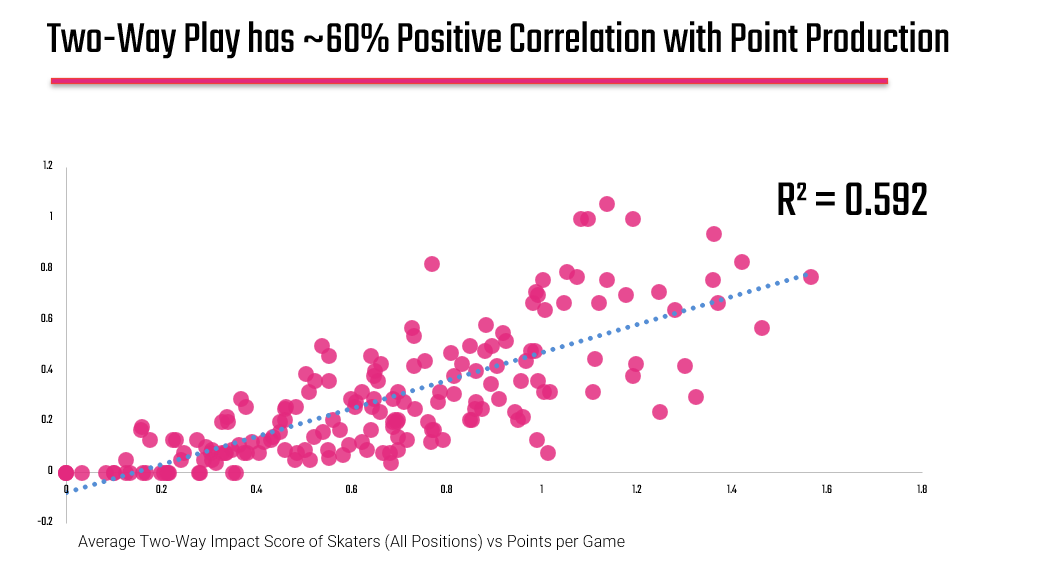
If the correlation were near 100%, TWIS wouldn’t tell us anything new; it would just mirror scoring. If it were near zero, it would suggest that two-way play doesn’t translate to outcomes. But sitting in the middle, around 60%, it tells us something more nuanced: two-way impact contributes to scoring, but it doesn’t fully define it.
For creators, this is a powerful moment. You now have tension in the data. Some players score without driving full two-way impact. Others drive strong two-way performance without elite point totals. That gap between perception (who we think is best) and reality (who controls the game) is where compelling narratives emerge.
Check out our Instagram site for more PWHL coverage in the weekly series entitled Within the Numbers.
TWIS for Teams & Players
Let's start with teams because players don’t operate in isolation; they exist within systems. By averaging TWIS at the team level, we can begin to see how organizations are structured and systems are implemented. And the pattern is clear: the top teams tend to cluster around higher average two-way impact scores.
This introduces another layer of the story: team construction. The best teams in the PWHL aren’t just built around scoring talent. They’re built around balance. They emphasize systems that support both offensive generation and defensive control. Lower-ranked teams, by contrast, often lean heavily in one direction, either chasing offense at the expense of defense or relying on defensive structure without enough attacking output.
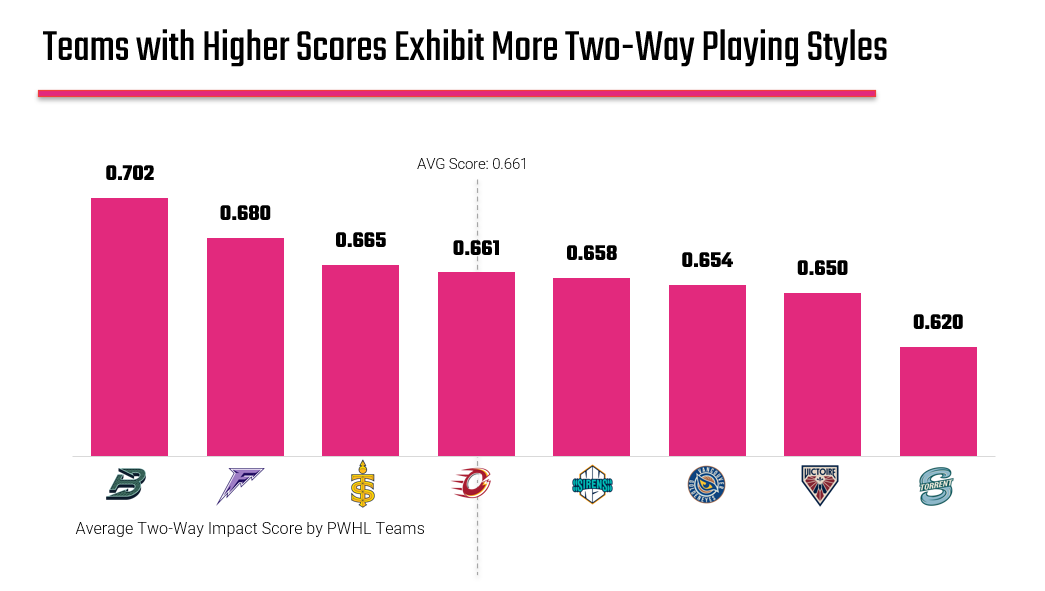
Again, this isn’t just a hockey insight. It’s a storytelling principle. When you move from individual metrics to aggregated team metrics, you’re shifting from performance to strategy. You’re asking not just who is good, but how success is built.
Finally, we return to the players, this time with context. By ranking the top performers in TWIS, we can identify the individuals who consistently tilt the game. Some of these names are expected. Elite players tend to show up in any well-constructed metric. But what makes this interesting are the players who appear here without leading traditional scoring charts.
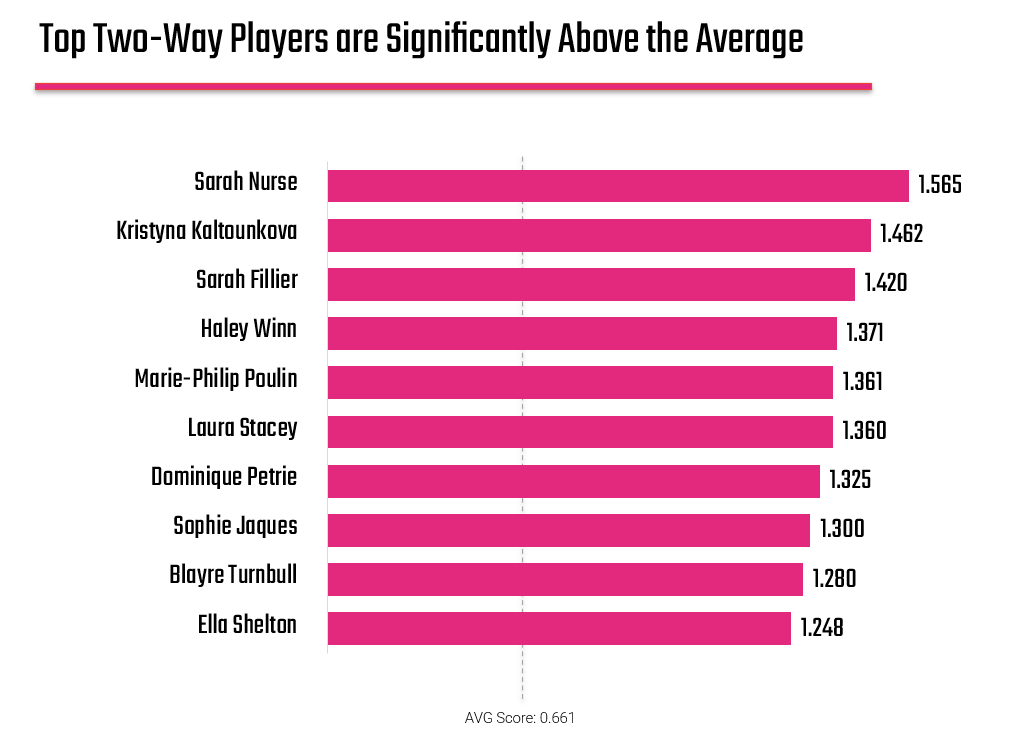
These are the players who break narratives. They’re not always the ones featured in highlights, but they are often the ones driving outcomes shift by shift. They win puck battles, disrupt plays, and transition the game in ways that don’t always translate directly into points. TWIS gives us a way to quantify that impact.
Want to see more sports stories? Explore the projects and sports stories published on Stories.
Finding the Narrative in this Data Story
What makes this dataset useful for storytelling is that it supports multiple perspectives. You can approach it from the lens of player evaluation, team construction, or even league-wide trends. Each angle is valid, but each leads to a different narrative.
And that’s the broader lesson here. Data doesn’t come with a single story attached to it. It comes with potential stories. Your job as an analyst or creator is to identify which one matters most to your audience and then shape it into something clear, focused, and engaging.
In this case, the central idea is simple: the players and teams that control both ends of the ice are the ones shaping outcomes in the PWHL. But the path to that idea—through metric design, distribution analysis, correlation, and ranking—is what gives the story its depth.
That’s what separates data reporting from data storytelling. Reporting tells you what happened. Storytelling helps you understand why it matters.