Predicting the Winner of the 2025 Stanley Cup Playoffs
This is the second post in a four-part series that explores how to create a data story that predicts who will win the Stanley Cup playoffs.
At a Glance
- Source hockey data (that you can also use for predictive modeling) for free.
- Design your EDA around discovering the shape and symmetry of data.
- Think forward towards your predictive modeling when analyzing your data.
Introduction
In the first part of this series, we walked through the data story entitled: Predicting Who Will Win the Cup. The data story (i.e., the content that manifested the story) is a social post that predicts who would win the Stanley Cup. We used a Win Percentage value (19%), which represented the probability that Winnipeg was going to win the Cup.
We also walked through the potential flaws in our approach, exploring three different approaches to building the predictive model: 1) Goals For per Game (GFPG), 2) Pythagorean Win Percentage (PWP) and 3) Bayesian Probability. We noted where you might use one approach over another.
Sign up today to get data engineering and analysis and best practices delivered to your inbox!
This data story is a social post that will be updated regularly; not just a single, point-in-time post. Thus, the predictive model must update regularly as well – and stay current to the most recent game results. The flaw in the GFPG approach is that it is based on the regular season stats, so represents a baseline rather than a moving prediction.
This is the second in a four-part series, where we'll cover sourcing the data and our approach to the exploratory data analysis (EDA).
Sourcing the Data
For larger projects, you may want an end-to-end data pipeline that refreshes daily. For smaller, ad-hoc projects a manual download will likely suffice. For this data story, we assume a single snapshot of data and a shoestring budget – so we'll manually source publicly available data.
Want to build your own data pipeline? Check out our quick-hit video below.
Having downloaded the data, you should clean, transform and analyze the data with both the EDA and predictive model in mind. To do this, go wide on the number of statistics in the raw data. This gives you flexibility in your EDA and gives you more features when conducting your predictive modeling.
We used Hockey Reference to source the data, which has a ton of data across players, goalies and teams. The site also has an easy way to download multiple CSVs, which you can manually concatenate into a single file. For example, the page below shows the aggregated team statistics for the 2024-2025 Regular Season. To download, click Share & Export and Get table as CSV (for Excel).
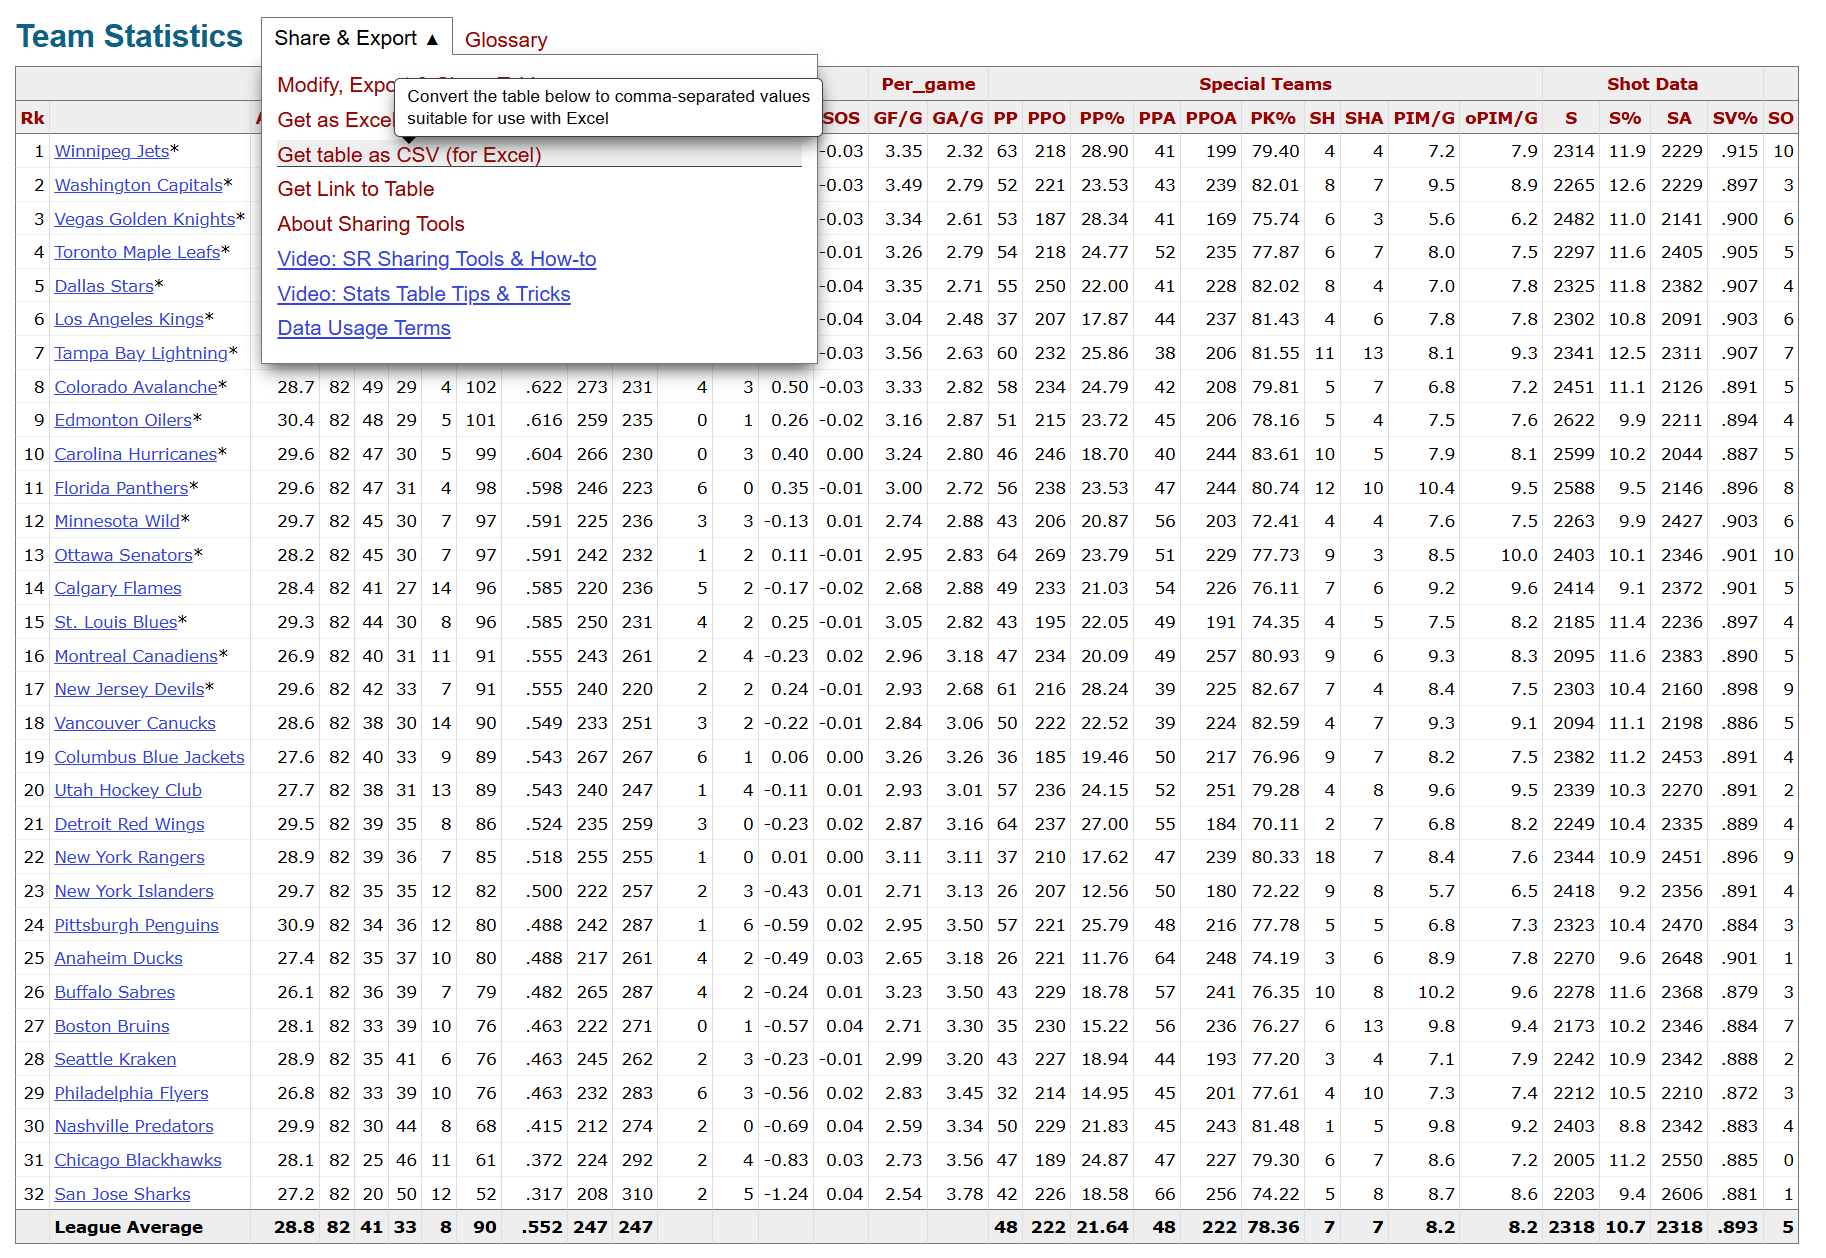
Two different ways to access data from Hockey Reference are via manual download or web scraping. Web scraping can mean some level of coding and makes sense for repeated data updates. We downloaded the files for four seasons (2021-2022 to 2024-2025) resulting in four CSV files, which we combined into a single CSV file using Python.
The downloading of the data took no time at all, but we had to clean up the datasets before combining the four different files – e.g., adding a SEASON column, removing metadata rows and league average rows, renaming a few columns, etc.
We've added data, Excel files and any code files to our GitHub repository.
Exploratory Data Analysis (EDA)
Generally, an EDA discovers data shape, trends and patterns. The EDA is typically the first analytical stop in your data story project. Use your EDA to understand the shape of your data, trends and patterns. Also, look for outliers; great stories hang out there.
For more details on how to analyze sports data, check out the newsletter entitled Basics of Data Analysis for Storytelling.
For this data story, our EDA provided a few key insights when comparing playoff teams to those teams that didn't make the playoffs (non-playoff teams).
| Metric | Playoff Teams | Non-Playoff Teams | Insight |
|---|---|---|---|
| PTS PCT | 0.641 | 0.467 | Higher points obviously correlate with playoff qualification |
| GFPG | 3.31 | 2.86 | Playoff teams score significantly more |
| GAPG | 2.80 | 3.37 | Playoff teams allow fewer goals |
| PP PCT | 23.16% | 18.94% | Better special teams on offense |
| PK PCT | 80.3% | 77.3% | Slightly better defensive special teams |
| SAVE PCT | .904 | .893 | Goaltending matters a lot |
| CORSI PCT | 52.03% | 48.53% | Strong possession advantage |
| xG FOR | 181.66 | 165.82 | More expected scoring chances |
| xG AGAINST | 164.98 | 182.50 | Fewer dangerous chances allowed |
| HDF PCT | 52.02% | 47.89% | Better at controlling high-danger areas |
| PDO | 100.55 | 99.48 | Slightly better puck luck or efficiency |
Generally, then, playoff teams tend to perform better, and the above shows you where and by how much.
Beyond the EDA, we were primarily interested in three questions:
- What is the profile of the previous three Stanley Cup winning teams?
- How do the current teams compare amongst each other and against the prior winning teams?
- Who is most likely to win the Stanley Cup this year?
We explored the first two in the EDA and reserved answering the third through the predictive modeling.
What is the Profile of the Previous Winning Teams?
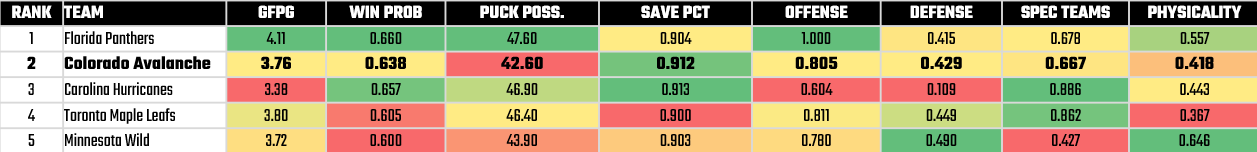
Interestingly, the last three Cup-winning teams did not finish first overall in their respective regular season and they didn't have the best stats. For example, in 2021-2022 Colorado won the Stanley Cup; however, save for goaltending most of their stats were middle of the road, their puck possession was the lowest of all teams and they weren't particularly physical. Yet they managed to pick it up in the playoffs and beat the other teams – including the top-ranked (and a very physical) Florida Panthers.
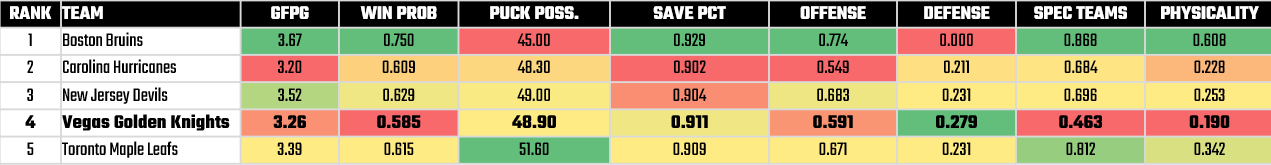
You see a similar pattern in 2022-2023 with the Vegas Golden Knights. Boston, who came in first overall, ironically had a suboptimal showing in those playoffs.
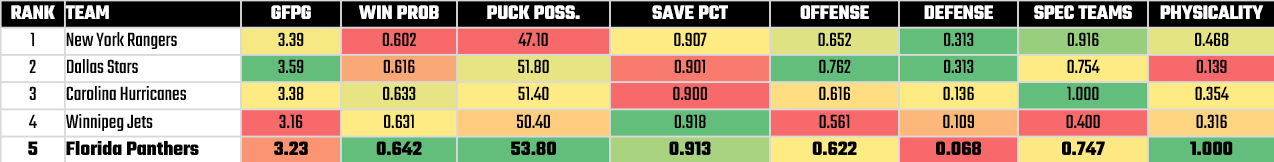
In 2023-2024 we see a slightly different trend: while not finishing first, Florida had a more balanced statistical outlook and won the Cup. It didn't hurt their game that they were more physical than the other teams. And after three years vying for the Cup, the Panthers finally came out on top.
So, is there a predictable pattern here among the Cup-winning teams? Not really, but perhaps a few notables:
- None of them finished first in the regular season.
- They all had strong goaltending.
- None of them were consistent in any one area – such that it seemed like a good predictor.
- Each of the teams played different types of games – e.g., Florida is very physical.
Let's turn to the 2024-2025 playoff teams.
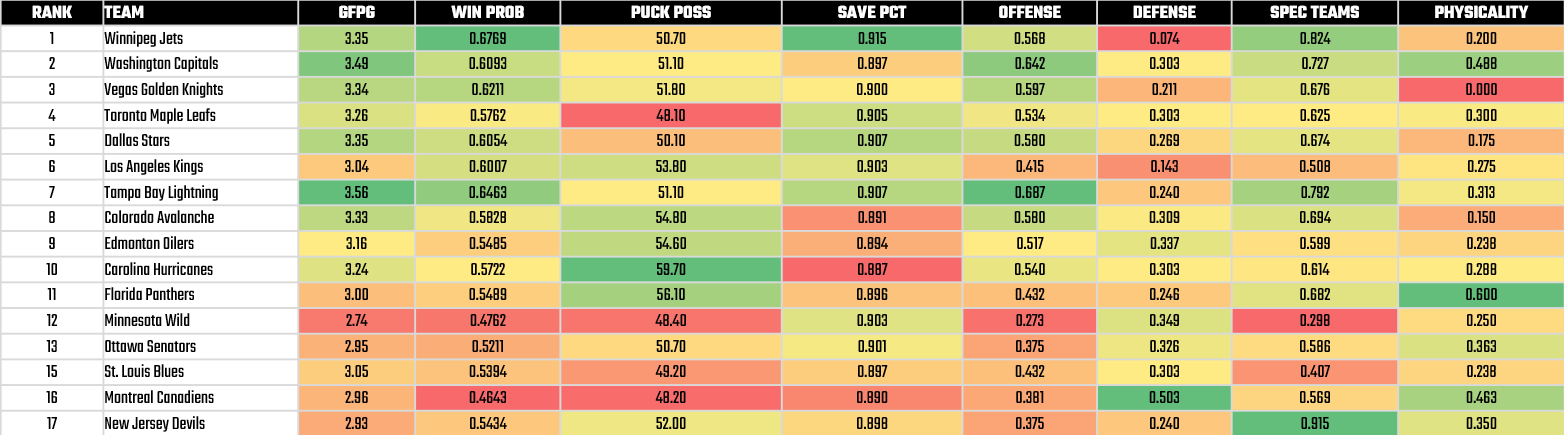
Below are the teams that made the 2025 NHL playoffs, ranked by Win Probability. The statistic show the same composite metrics representing different aspects of a team's performance. The heatmap visually indicates strength and weakness. And while there's some clustering on Goals For per Game and Win Probability in the top-ranked teams, there isn't one team that is consistently good across all metrics.
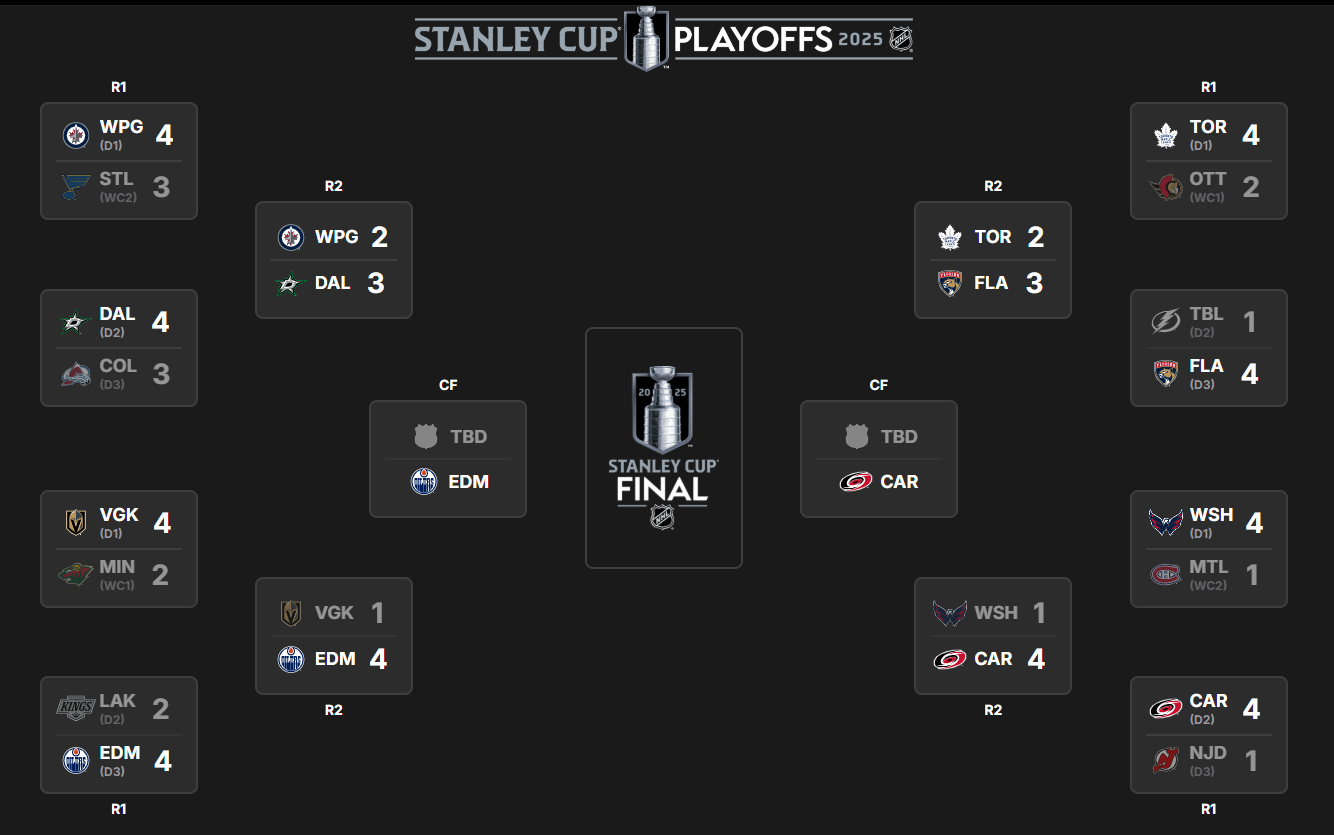
When we started this data story, it was the beginning of the 2025 playoffs. We've now had the opportunity to see who out of the above made it through Round 1 – and how the teams are faring in Round 2. As of today, here's where we stand.
This is where including some "pre-modeling" reports in your ongoing analysis can give you more context as you build and deploy daily models.
Pre-Modeling Reports
As a pre-modeling exercise, it's good to explore your data with your future predictions in mind. For example, we're going to switch our predictive modeling approach from GFPG to PWP, so wanted to explore average PWP over the past four seasons. Below are all teams, sorted by this year's PWP. Trends matter because teams may not shape shift their talent drastically one year to the next; they build. This context should factor into the context around your models.
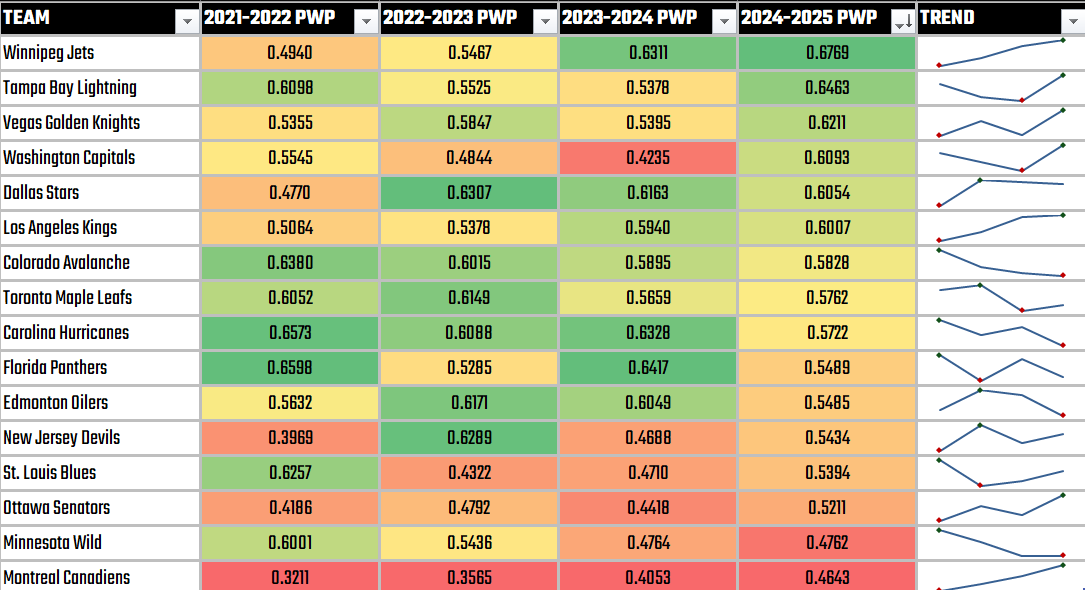
With this view, it's not surprising that certain teams have been eliminated (e.g., Montreal, Minnesota, Ottawa, St. Louis, and New Jersey); however, other teams are defying their statistics (e.g., Edmonton, Carolina, and Florida).
Armed with the benefit of hindsight, we can also create a view to discover surprise performances by teams when comparing the regular season to the playoffs. For example, here's a ranked view (by Playoff PWP). We've also included the PWP difference and whether the team is still in contention (i.e., made it to Round 2).
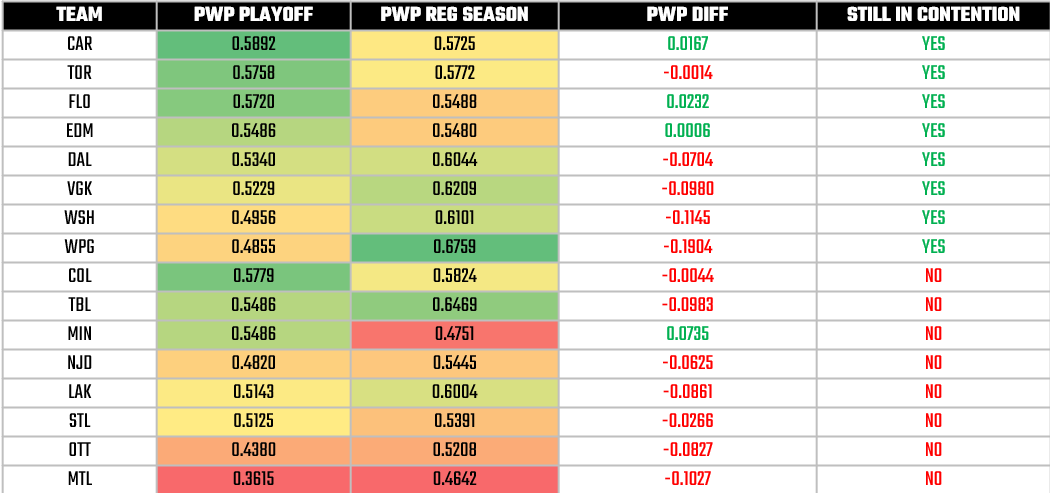
This view gives us some information that can inform our modeling work:
- When ranked by Playoff PWP, the ranking has changed substantially from the regular season – e.g., Winnipeg, Tampa Bay and Washington have moved down and Carolina, Toronto and Florida have moved up.
- Save for Minnesota, all teams had a negative PWP.
- Three teams have notably improved: Carolina, Florida and Edmonton.
Now are the above predictive? No. But, they help give us some insight such that when we start building our model they can 'round the corners' on our understanding of the data (or offer suggestions for additional features to consider in your daily modeling). For example, if your model predicts that Montreal will win the Cup, then you may want to re-factor something.
Join today to learn how to build predictive models for your sports data story!
And when building predictive models that need to be updated after each game, it's helpful to have additional reports like the above for broader context.
Summary
This was the second in a four-part series, which focused more on the exploratory data analysis or EDA. Generally, an EDA can be broad – focusing on discovering the shape of the data, patterns and trends. The EDA gives you areas to focus in on, exposes outliers, and expands your initial hypothesis or question set.
We had three questions that drove our data story.
- What is the profile of the previous three Stanley Cup winning teams?
- How do the current teams compare amongst each other and against the prior winning teams?
- Who is most likely to win the Stanley Cup this year?
We drove two of the questions from the EDA through specific reports (summary and pre-modeling reports) and will cover the third question in the third part of this series – focusing on building the predictive model using the PWP approach.