In this lesson, we'll review the big question, which is: Who are the top, incoming prospects for the NHL 2026 Draft?
Home | Lesson 1 | Lesson 2 | Lesson 3 | Lesson 4 | Lesson 5
Is this a Good Question?
Before we get too far, is this actually a good question? Meh. Not really.
In fact, it's a bit crap to be honest. Granted, it's directional – but too high level, vague and leaves too much room for interpretation.
So, let's take another crack at it.
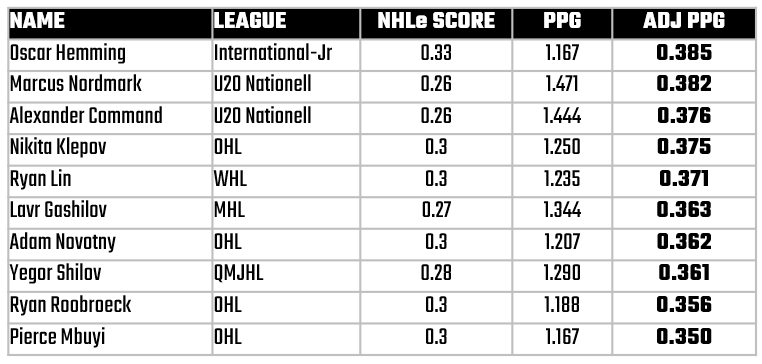
Who are the top 10 forward incoming NHL 2026 Draft prospects, ranked by Points per Game?
This isn't perfect, but it's better – the bolded elements give us more that we can use to answer the question (i.e., a specific number of players, position and metric, etc.).
Answering the Question
If you think forward, you'll likely sketch out a mental workflow like the following:
- Get the data of the top-ranked minor-league players.
- Be sure the stats include Games Played and Points (at a minimum).
- Rank the players by Points.
- Create a calculated column for Points per Game.
- Sort by Points per Game in descending order.
- Filter on the top 10 players.
Now you could stop there, but with any professional sports league (and statistical analysis), you need to continue to think through the assumptions behind answering this question and figure out your methodology. For example, there are multiple minor league and amateur hockey league systems that feed into one NHL league. And each league is slightly different – e.g., in style of play, ice size, development programs, etc. Further, there are multiple professional analyst opinions on who makes the grade, as you can see on the Elite Prospects Draft Center page.
In short, not all Points per Game are created equally. So, what do you do?
For the NHL, there's a nifty statistical tool you can use called the NHL Equivalency metric (NHLe). The NHLe provides what is tantamount to a conversion score that you can use to standardize Points per Game from different leagues into a 'standard' representation.
After applying NHLe, the translated number represents that player's potential productivity in the NHL (yes, so many variables at play here). For example, if Johnny McGoal scores 1 Point per Game in the OHL, and the NHLe for the OHL is 0.38, then his new, standardized Points per Game is 0.38. You can see more examples below.
So, let's go back to that high-level workflow and adjust it a bit.
- Get the data of the top-ranked minor-league players.
- Be sure the stats include Games Played and Points at a minimum. (But also include Goals, Assists and PIM, so you can gauge where a player may be strong, weak or undisciplined.)
- Rank the players by Points.
- Create a calculated field for Points per Game (this is Points divided by Games Played).
- Add a new column for NHLe and add it in for each league.
- Create a new calculated column for Adjusted Points per Game.
- Sort by Adjusted Points per Game in descending order.
- Start your analysis.
And now begins the fun.
What Now?
You may be wondering why we're not finishing here. It's because while the goal of answering the big question may be in motion, the quest to find a story is nowhere near at its conclusion.
For example, if a GM of a team is asking the question, then you'll want context around the top 10 ranked players such as their style of play, potential issues, are they a playmaker or goal-scorer, etc. Further, this living course is about creating a story, and this requires us to think through different angles (and hooks). From this context, focusing on the top 10 prospects is a bit of a snoozer.
So, as you think about the big question you're trying to answer, also think about who your audience is and in what format you'll be delivering that story.
👉 Up Next? Lesson 2: Show Me the Data