This module will analyze four hockey nations participating in this year's Olympics to determine who has the best chance at winning the Gold medal at the 2026 Men's Hockey tournament.
On this Page
Learning Objectives
By the end of this module, you will be able to:
- Locate, clean and use player performance data to evaluate four nations in the upcoming Olympics.
- Compare the teams in different ways using a core set of average metrics.
- Translate your analysis into an infographic that tells a fun and compelling story.
Module Map
This module contains the following progressive lessons.
- Lesson 1: The Big Question
- Introduces the 'big question' that this module will analyze.
- Lesson 2: Show Me the Data
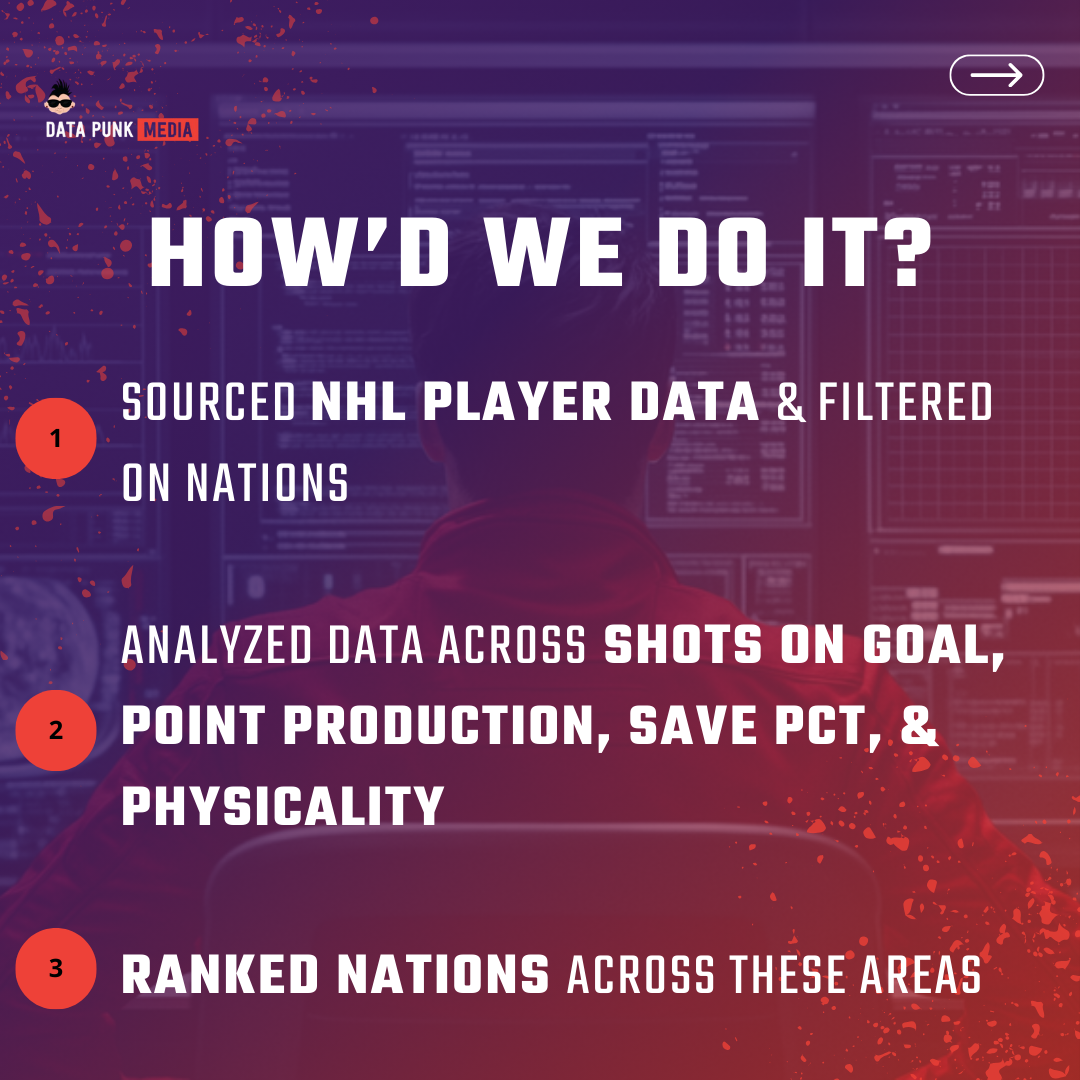
- Learn how we sourced and curated the NHL data (and filtered to four nations).
- Lesson 3: Stats and Methodology
- Understand the stats that matter and how to use them in an analysis.
- Lesson 4: Data Analysis and Visualizations
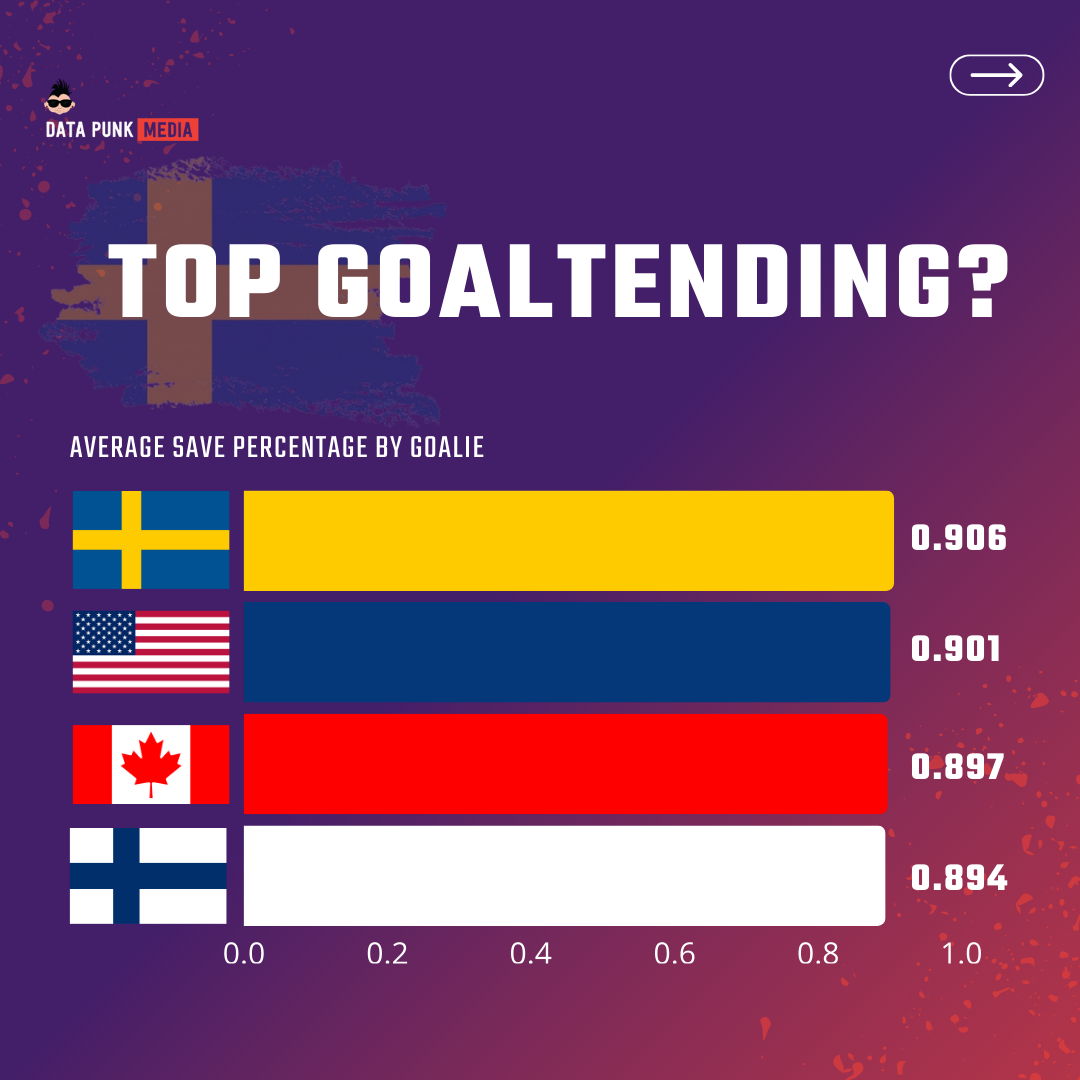
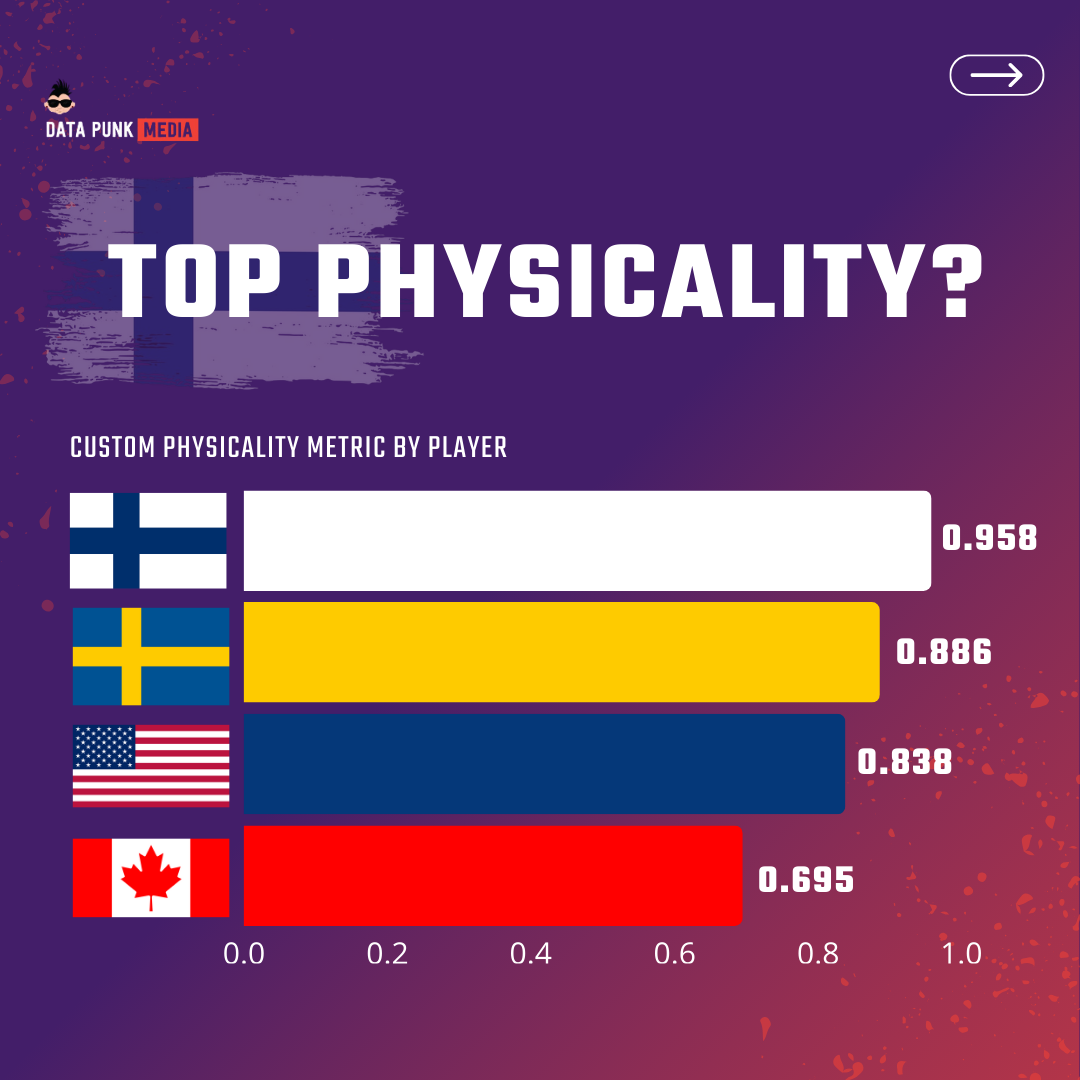
- Compare four teams worth of NHL player performance data – to ultimately analyze who might come out ahead.
- Lesson 5: Discovering the Storyline
- Create a story flow that can be represented through an infographic.
Module Resources
Below are key resources you can use to follow along with this module.
- 4 Teams Worth of Player Performance Data
- Microsoft Excel Data Analysis
- R Code to Analyze the Player Performance Data
All module resources can be found at our Data Punk Media GitHub repo folder.
Published Story
In our storyline lesson, we covered off on three story angles – national rivalries, underdogs and point leaders. There is legitimately multiple ways to take the data in this lesson and build out your own story.
For our story, we chose a more traditional learning path and posted an Instagram reel with multiple slides that walked through our analysis. Less of a human interest story and more of a learning instrument.

Our goal in publishing the above was more around teaching how we walked through the analysis. Make sure you think through who your audience is and your modality, and then explore potential storylines that fit better with who you're talking to, the goal of your story and the platform to which you're publishing your story.
Check out our Stories page for more deep dives on different data stories.
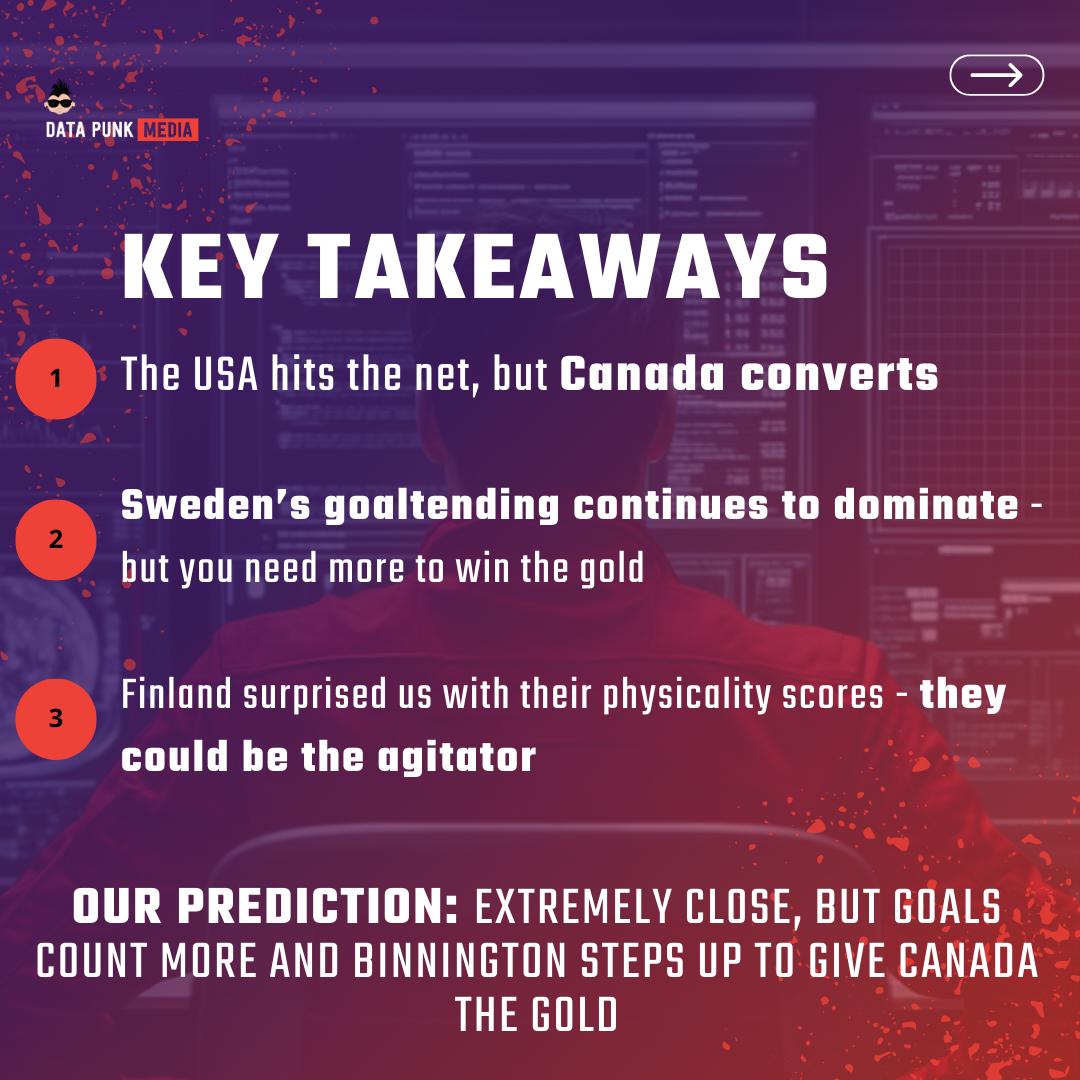
Key Takeaways
Some of the key takeaways for us that we discovered throughout this module.
1. There are multiple ways to build and deploy your analysis
This goes for any analysis you do, but especially for what we did here. We chose to look at the players and then aggregate, but you could have looked at previous medal counts or got deeper on the specific strengths and weaknesses of a team.
However, regardless of what your analysis is, be sure you note your assumptions and test out different ways to analyze the data. In short, triangulate your analyses so you are generally reaching similar conclusions across your analyses.
2. Custom metrics don't always work
Most of the time we stick to standard hockey (or sports) statistics. This is because they are tried and true and when presented, analysts understand them and stories built on those statistics hold up. (You don't want a narrative falling apart because you've created an ill-formed custom metric.)
We used raw hockey statistics to build a custom metric for Puck Possession, and we weren't super happy with the results. For us, this means going back to the drawing board and thinking through how a custom metric is better or worse than an existing standard metric. And if that standard metric is hard to find, do the work to find it and then find a way to integrate it seamlessly into your dataset.
3. The Olympics provide for a rich set of stories
We love the Olympics. This year is especially trying for US athletes as they are representing the highest pedestal of patriotism, yet dealing with some trying times at home. The athletes are composing themselves well, delivering awesome messages of love, compassion and unity – the key constituent pieces for a top-performing team. This. Is. Amazing.
That said, there are so many interesting stories that you can tell with Olympic sports. For example, you could focus on the plight of the athlete to represent their nation; you can explore how teams work together (and can come together in such a short period of time); you can explore how the Olympics can make records for different athletes; and you can explore the history of rivalries and where these rivalries may be going.
And to be frank, the analysis that we put together is nothing compared to what is possible.
Additional Resources
And finally, here are some additional resources that you might find useful in your sports storytelling journey.