This module helps you analyze draft prospects for the NHL and explores ways to create sports stories from that analysis.
On this Page
- Learning Objectives
- Module Map
- Module Resources
- Published Story
- Key Takeaways
- Additional Resources
- Up Next
Learning Objectives
By the end of this module, you will be able to:
- Locate and evaluate reliable data sources for NHL draft-eligible prospects.
- Apply equivalency and adjustment metrics to compare players across different leagues.
- Identify strengths, risks, and uncertainty in prospect data.
- Translate your analysis into a clear, compelling story for fans, media, or teams.
Module Map
This module contains the following progressive lessons.
- Lesson 1: The Big Question
- Introduces the 'big question' that this module will analyze.
- Lesson 2: Show Me the Data
- Learn where draft prospect data lives and how to source it.
- Lesson 3: Stats and Methodology
- Understand the stats that matter and how to use them in an analysis.
- Lesson 4: Data Analysis and Visualizations
- Compare players across leagues in a meaningful way.
- Lesson 5: Discovering the Storyline
- Identify patterns, tiers, and uncertainty in prospect profiles such that a story emerges.
Module Resources
Below are key resources you can use to follow along with this module.
- NHL 2026 Prospects Dataset (Curated from Elite Prospects)
- Top Prospects Data Analysis (Microsoft Excel)
- Top Prospects Data Analysis (R Code)
All module resources can be found at our Data Punk Media GitHub repo folder.
If you're short on time, be sure to check out our quick-hit walkthrough below on YouTube!
Published Story
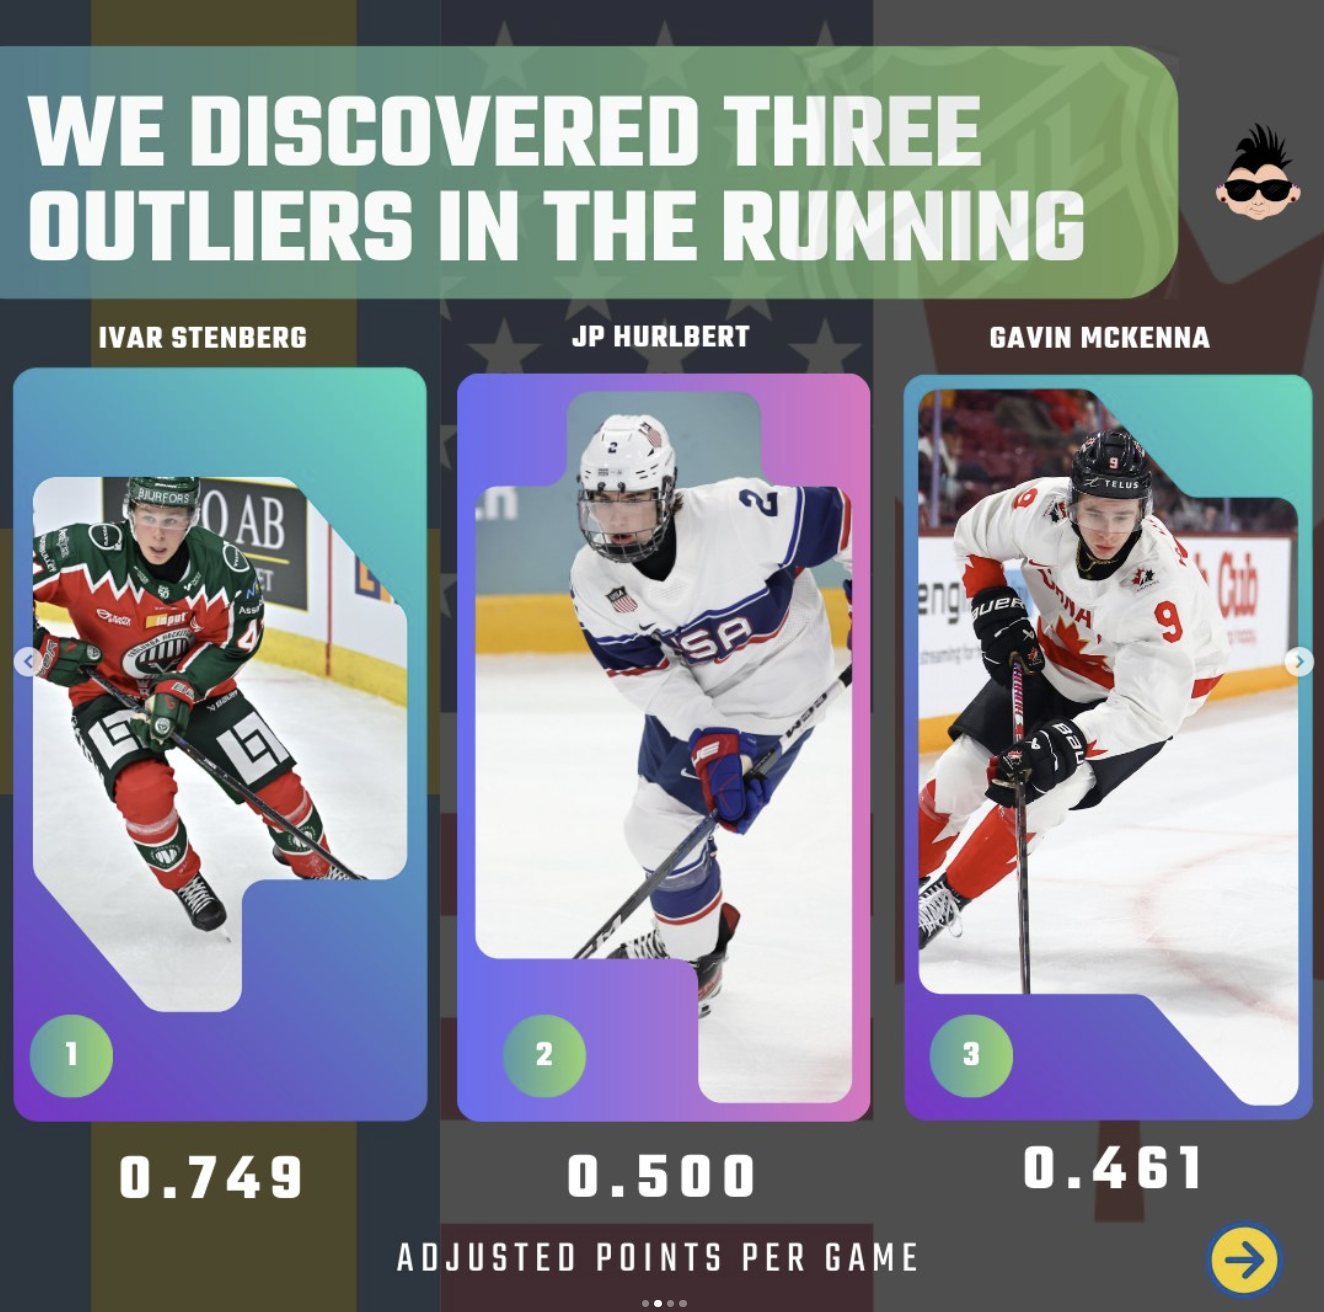
You can take this story and publish in any number of ways. For example, you could create an article or blog and focus on one or more of the themes we highlighted earlier; you could create a short 5-minute documentary on how Sweden is contributing to the NHL with Ivar Stenberg being the latest prospect; and you could even create a carousel or reel that takes the top 3 outliers and whittles it down to 1. The latter is what we did as an example of how to take this analysis and implement it as a story.
We'll likely do more stories on prospects in the future. With the NHL's global reach, we're now seeing amazing prospects coming in from all around the world.
Check out our Stories page for more deep dives on different data stories.
Key Takeaways
The below summarizes learnings and takeaways that you can apply to your own storytelling projects.
1. Be careful with equivalency scores
This is especially so when you're translating across so many leagues to express and represent potential at the NHL level. The NHLe is not perfect; it's directional. And you can find discrepancies in the way each league is scored. So, if you choose to rely on this within your model, be sure to note this as an assumption.
2. There isn't a lot of data when it comes to prospects
This is unfortunate because it's an important part of gauging evolution from the minors into the pros. You saw that we a 'small data' problem with, for example, a low number of Games Played for some of the players. Arguably, you'd want to see 20+ games to get a sense for trend and player performance.
3. Attack the data from different angles
You saw in this module how if we were to approach the data singly from the Adjusted Points per Game angle, this may ignore other important elements (e.g., statistical bias from a lower number of games played, high PIMs indicating potential disciplinary issues, etc.). And when you do use different methods, there are points of conflation that are more qualitative. This is where you expertise and understanding of the game come into play.
Additional Resources
Here are some additional resources you may find useful.
- SHL vs the NHL
- About the NHLe (And Other Methods of Equivalency)
- What is a Z-Score?
- What is K-Means Clustering?
Up Next
In our next module, we'll focus on What Makes a Superbowl Championship Team?