This module will introduce our Super Bowl Winning Index (SBWI), which is one way to profile championship NFL teams.
On this Page
Learning Objectives
By the end of this module, you will be able to:
- Locate, clean and transform NFL data to evaluate Super Bowl championship teams.
- Create a composite metric to characterize the profile of winning football teams.
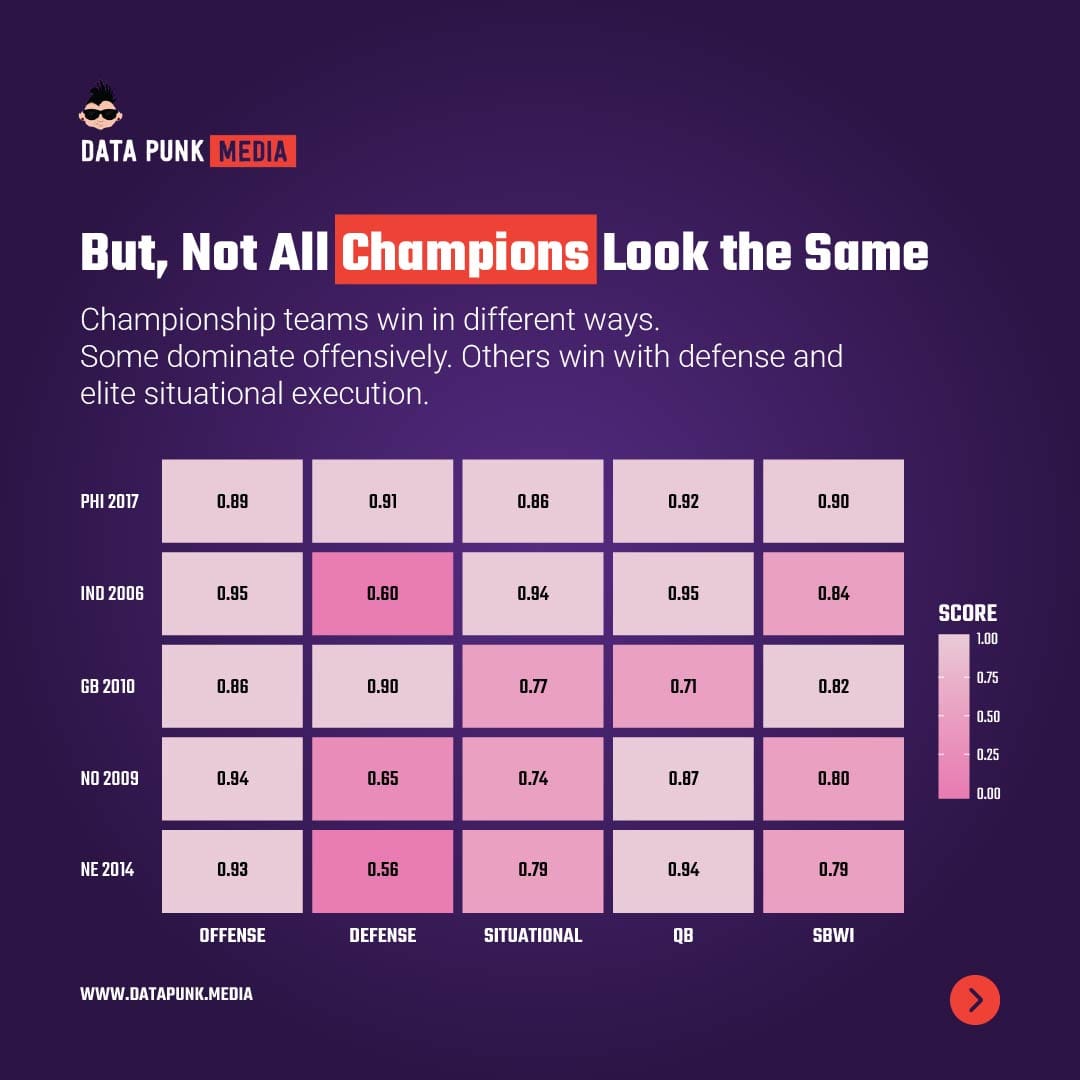
- Identify offensive, defensive and situational strengths and weaknesses in Super Bowl champions.
- Translate your analysis into an infographic that tells a fun and compelling story.
Module Map
This module contains the following progressive lessons.
- Lesson 1: The Big Question
- Introduces the 'big question' that this module will analyze.
- Lesson 2: Show Me the Data
- Learn where the NFL Super Bowl data was sourced from and how we cleaned and transformed it.
- Lesson 3: Stats and Methodology
- Understand the stats that matter and how to use them in an analysis.
- Lesson 4: Data Analysis and Visualizations
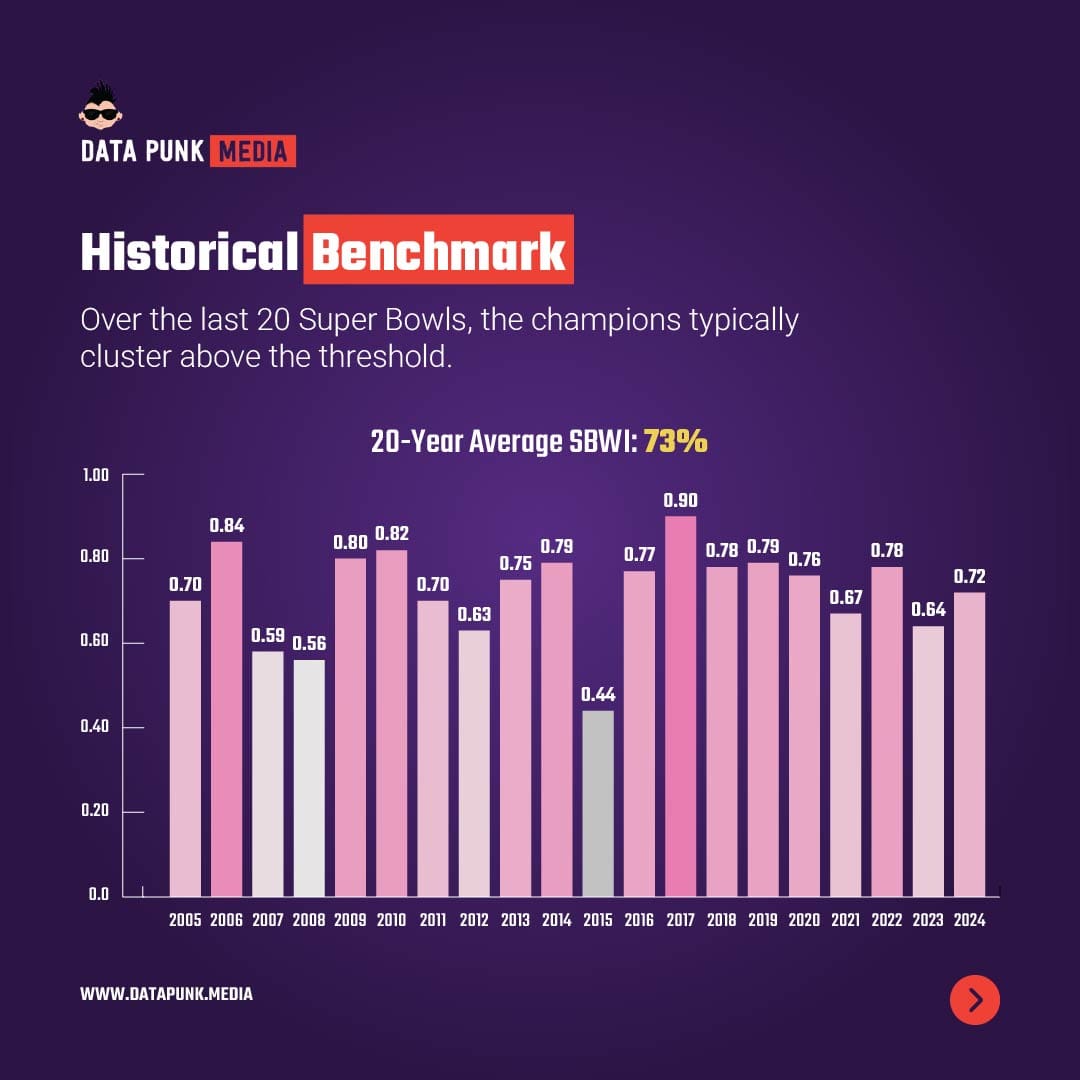
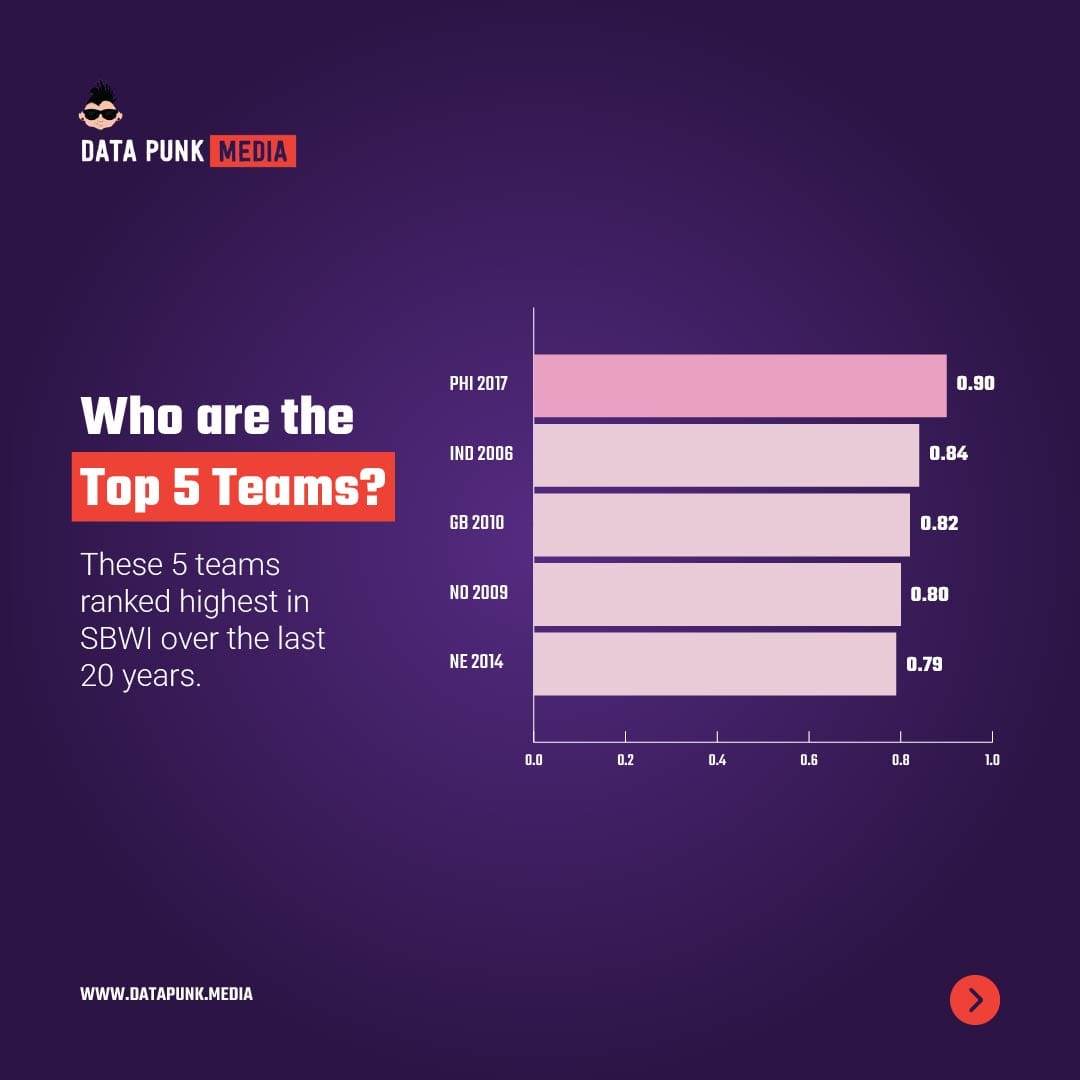
- Compare 20 years worth of Super Bowl winning teams.
- Lesson 5: Discovering the Storyline
- Create a story flow that can be represented through an infographic.
Module Resources
Below are key resources you can use to follow along with this module.
- 20 Years of NFL Data for SBWI Calculation
- Python Code to Extract and Clean the 20 Years of NFL Data
- R Code to Analyze the Data and Create Visualizations
All module resources can be found at our Data Punk Media GitHub repo folder.
Published Story
For our story, we chose to keep it simple: we published an infographic that captured the highlights of our 20-year data analysis. It's posted on our Instagram site, but we've added the slides here for quick viewing.
We've also explored a few other potential stories that you could create with the data in Lesson 5 (Discovering the Storyline) of this module.
Check out our Stories page for more deep dives on different data stories.
Key Takeaways
The below summarizes learnings and takeaways from this module that you can apply to your own storytelling projects.
1. Be creative with metrics, but don't assert success until they are tested
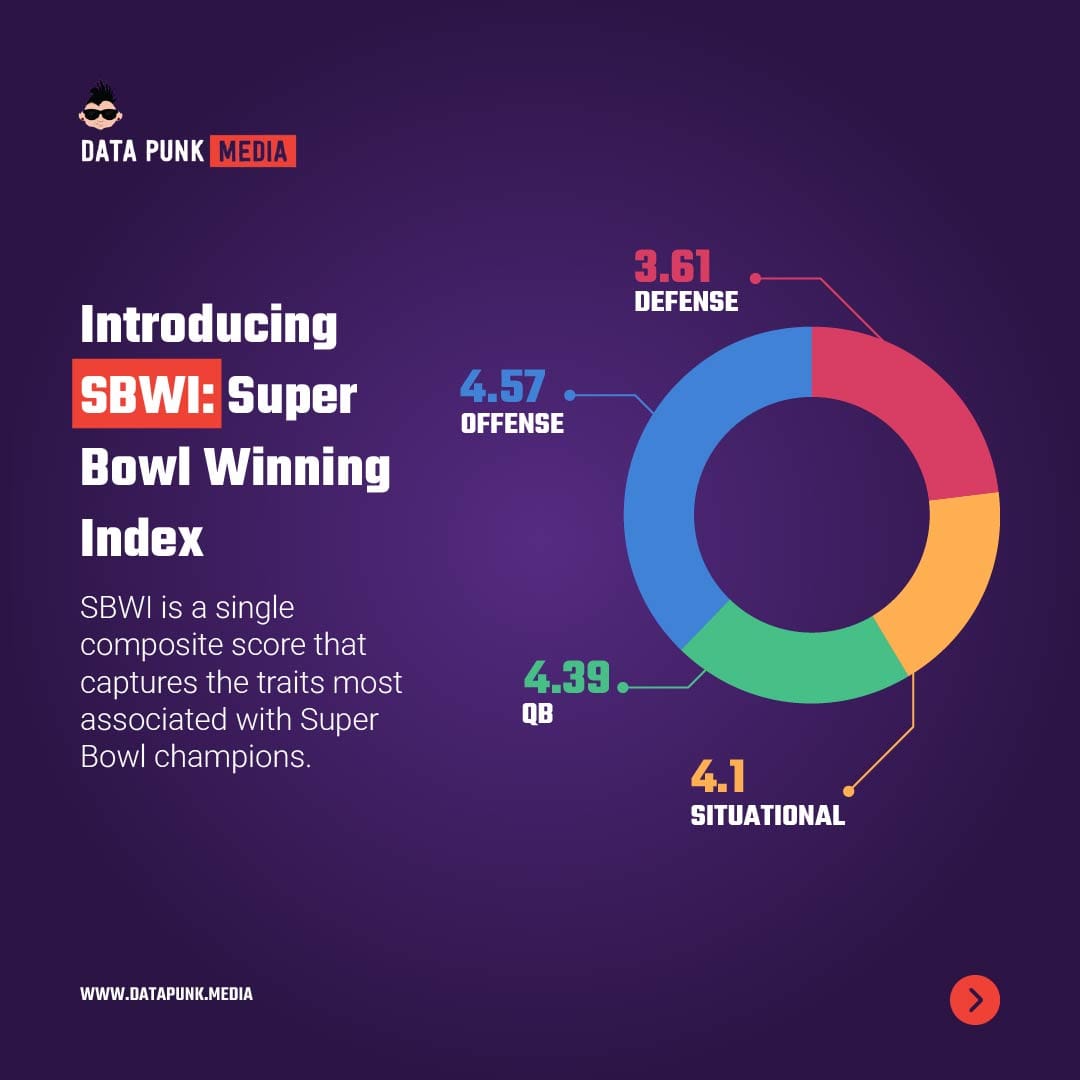
The Super Bowl Winning Index (SBWI) is a novelty metric, which we used as a way to represent team performance in a more composite manner. If you're an aspiring Data Analyst, Data Scientist, Sports Scientist or Sports Analyst, you will surely be creating custom metrics and/or features for your predictive models. Don't be shy about creating these types of metrics and features, but a) be sure they are practical for you and your analysis, b) they have some contextual representation and c) you test them thoroughly.
2. Averages can be very useful
This may be obvious for those of you with experience in statistics; the mean shows up everywhere. If you're new to stats, though, start with central tendency and descriptive statistics. You can actually get some pretty decent analyses out of a simple set of statistics. You can also look at data in the aggregate, as a snapshot, across a time series, or even at the player or team level – so you can evaluate the data with some simple statistics through several lens and still come up with a decent report.
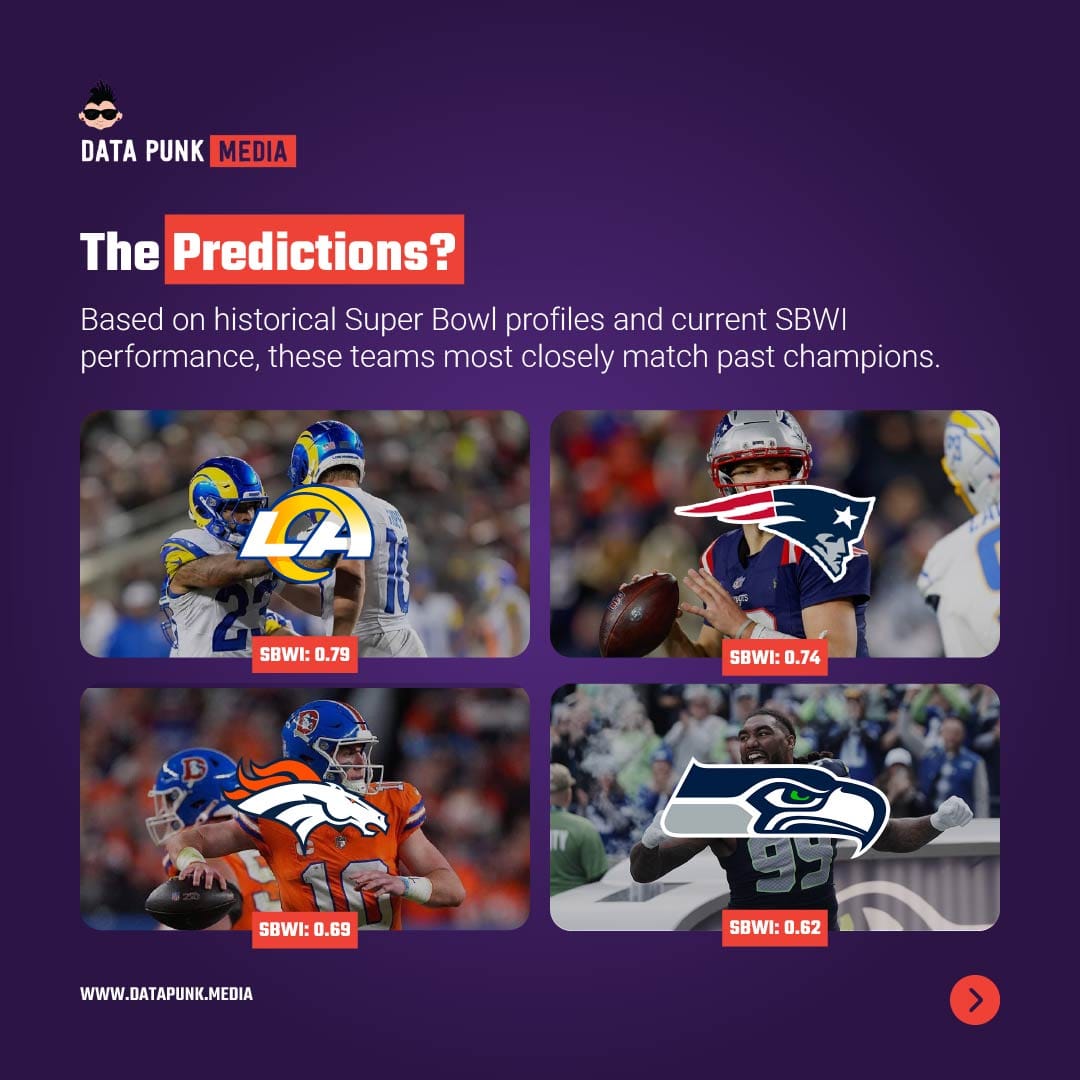
3. Be aware of the events you can't predict (at least very well)
Predicting events is a difficult thing to do. The approach, math and deployment (in short, the how) is more involved than creating a report. In many cases, you start your analysis in a similar way – i.e., exploring descriptive statistics, central tendency, summary to detail views, etc. However, for predictions you use this part of the process to understand the data. The tough part, though, is trying to account for all of the variables that may happen in a game.
For American football, it's especially tricky because some events can have massive consequences. For example, during the recent Conference Final between Seattle Seahawks and Los Angeles Rams, Riq Woolen took a completely unnecessary infraction (and was subsequently fined for it). According to Richie Whitt:
With Seattle leading 31-20 late in the third quarter, Woolen broke up a 3rd-and-12 pass. But as the Rams' offense ran off the field preparing for a punt, Woolen began chirping at receiver Puka Nacua, head coach Sean McVay or any other Ram that would listen. He was flagged for taunting, and on the next play the Rams soon threw a touchdown over Woolen to make the game interesting.
If you watched the game (and were a Seahawks fan), this was a complete and utter unforced error that put the Rams back into contention. For the squeamish, it made the fourth quarter unnecessarily interesting and close.
Point being, understand what you can predict and to what degree you can predict. An unforced error in hockey might be okay early in the series (there's plenty of time to recover); however, for one-game playoff series there's very little grace for errors.
Additional Resources
We have an international community here, so we realize that not all of you are familiar with American football. Further, some of you have yet to dig into statistics and predictive modeling. So, a few resources that might help you in your travels.
- NFL Rookie's Guide
- Understandable Statistics: Concepts and Methods (This is an undergraduate textbook, but is a great practical introduction to statistics.)
- Football Analytics with Python & R: Learning Data Science through the Lens of Sports (A data science book that explores the end-to-end process using American football examples.)