Predicting the Winner of the 2025 Stanley Cup Playoffs
This is the first in a four-part series that explores how to create a data story that predicts who will win the Stanley Cup playoffs.
At a Glance
- Decomposing the data story into its constituent parts.
- Several paths exist for good predictive modeling, but any path should include multiple checks and validation.
- Understanding what model to use (for what you're trying to achieve) can save you time.
Introducing the Data Story
Data stories come in different shapes and forms. For this series, the data story is a social post that predicts who will win the 2025 Stanley Cup finals. It's aptly entitled Predicting Who Will Win the Cup.
The data story is made up of a few ingredients. For example, we've got a title and text to engage the audience, along with some branding. Also, the base design used a Canva template to blend custom images to create a texture background.
Want to fast track your content creation? Check out our design templates.
The predictive data point in our data story is the Win Percentage, which is a predictive value representing the likelihood that Winnipeg will win the Stanley Cup. It uses regular season stats to calculate the 19%.
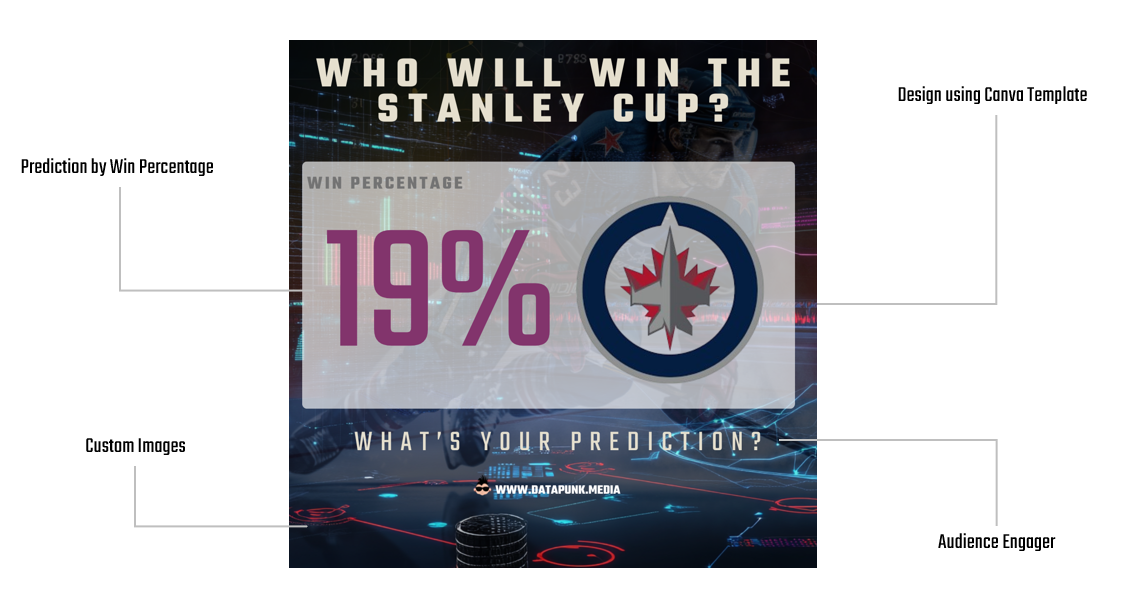
A data story like this shouldn't take you too long to create; however, there's a lot riding on that 19%. So, let's examine how you might get this number and the work along the way.
The Context around Predictions
What sits behind the 19% Win Percentage is a predictive model. Creating predictive models can be challenging. This is generally true with most sports, but especially true with hockey – anything can happen in a game and predicting all those variabilities is near impossible.
Even while AI is making it easier to access tools and algorithms, the context around those models relies on subject matter expertise – whether it's sports, entertainment or world events. So, let's step back and double-check the numbers and the context around them.
Sign up today to get data analysis and storytelling tips, tricks and best practices delivered to your inbox!
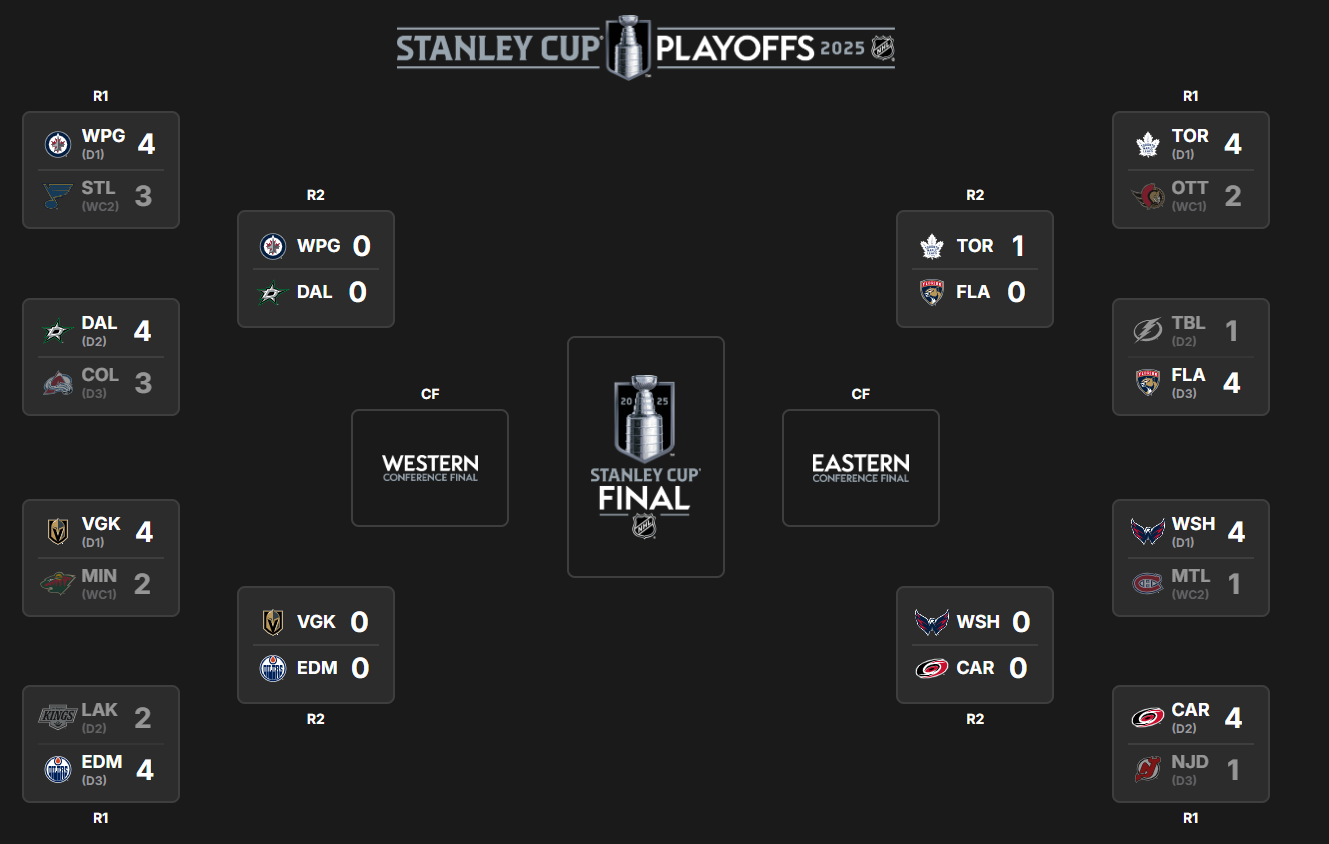
Checking our numbers is not just arithmetic. Take a recent snapshot of the 2025 playoffs. Round 2 has started, and most teams in the Eastern Conference had a few days to rest waiting for the Western Conference to catch up. Not only that, Winnipeg won Game 7 in an amazing (and unexpected) comeback in double OT. And while it's a possibility that Winnipeg could take the Cup, is it really 19%? (Yes, we hear you Winnipeg, but hope is not a strategy!)
Validating that 19% as the true value may mean taking another run at the data story and refreshing the data (e.g., game outcomes, stats, etc.), re-running the exploratory analysis and predictive modeling and working through the assumptions (and context) around the numbers.
The exploratory data analysis (EDA) explores core dimensions of a team's performance (and how the regular season performance is different from the playoff performance), and the predictive modeling builds off your refreshed data to create an updated model.
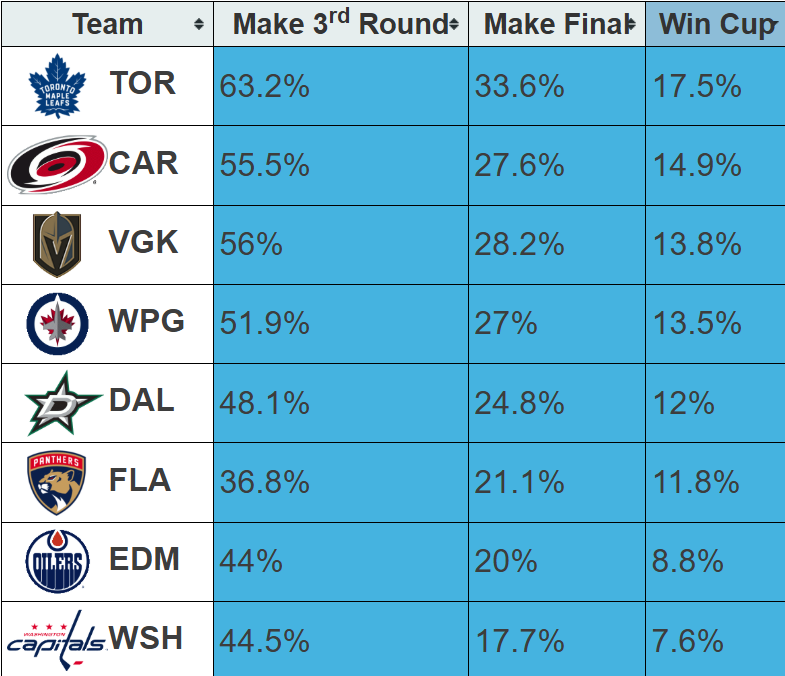
After you build a predictive model, check the sports books to see what they're saying. The bookies do this for a living, so their models are robust – a fraction of a percentage off and it costs them millions. For example, here's a recent snapshot of the odds on Money Puck. And while Winnipeg win the coin toss by a small margin in the series with Dallas, the model here for them winning the Cup is at 13.5% – clearly a step away from our 19%. In fact, even the Leafs don't make 19%.
A second source is ESPN, which can see below has other teams higher than Winnipeg to win the Cup. These are just two sources of many that are out there that can help you check your assumptions and numbers.
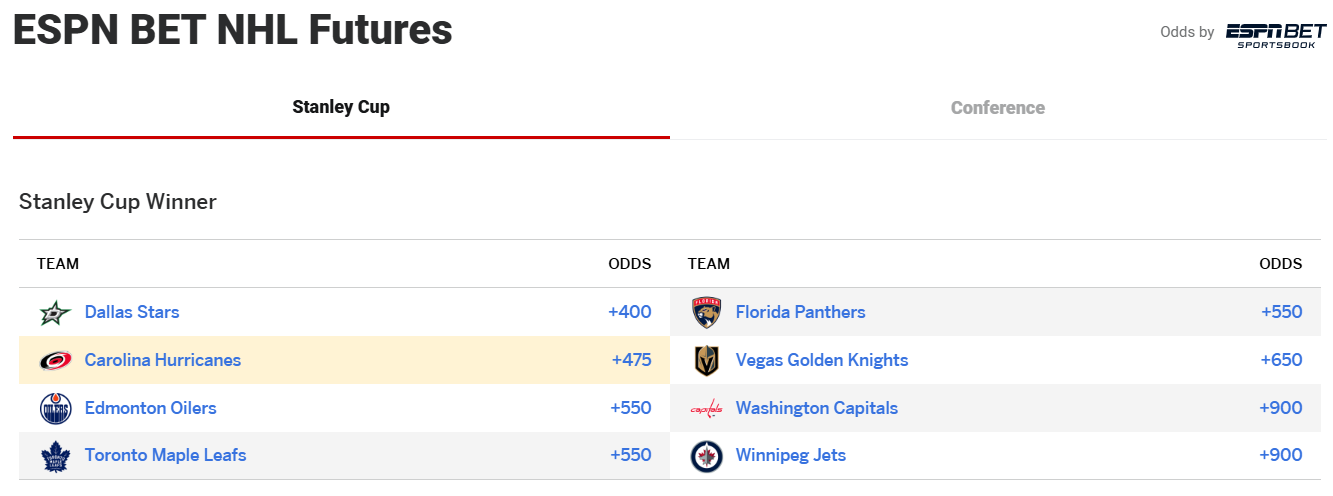
Key takeaway? Check the numbers of the pros against your own. And if there's a gap that you can't explain, you may want to run your numbers again – or explain the gap that gives your model an edge. There could be an amazing story here.
Choosing the Right Model
After you conduct an exploratory data analysis, you progress to building your predictive model. Your end goals should dictate your approach to building a predictive model. For example:
- You want to create a starting (baseline) view for the playoffs. Using regular season Goals For to build a Goals For per Game (GFPG) model is simple and practical. (We used this approach to get the 19% Win Percentage value.)
- You want to create a model that updates after each game. Using Pythagorean Win Percentage/Probability (PWP) and then updating it after each game would be more robust than the GFPG model.
- You want a model that is dynamic and current after (and potentially within) each game. Using Bayesian Probability with a complex of different statistics would be a good way to build and deploy a model to predict the playoffs.
Each of the above approaches uses different inputs and update patterns, so invariably the Win Percentage that results will be variable.
Want to learn more about the GFPG, PWP and Bayesian Probability approaches? Check out this YouTube video and newsletter on our companion site Data Punk Hockey.
Key considerations when building the predictive model(s) for playoff hockey are as follows:
- NHL playoff hockey is different from regular season play. Teams score 0.20 goals less on average in the playoffs, games are more physical (with higher penalties and injuries), goaltending becomes more important, and the overall pace of the game is faster.
- Teams step up their play in playoff hockey, and upsets can happen. In Round 1 of the 2025 playoffs, the Dallas/Avs and Winnipeg/St. Louis series wins come to mind.
- Teams that are number one in the regular season don't always win the Stanley Cup.
- Refs sometimes let calls slide in the playoffs. This opens up the game and makes it more physical.
For all these reasons, a predictive model based only on regular season stats will exclude predictive aspects of playoff hockey that would be useful for that model.
Summary
What Did We Cover?
We started with an end design that uses Win Percentage as the way to predict that Winnipeg will win the Cup by 19% (using the GFPG model). Given the "19%" as a predictive value carried the story, we deliberately honed in on it to test the value. By more deeply assessing the context around the value and comparing other predictions (e.g., Money Puck, ESPN, etc.), we found the 19% was high.
We then showed you different approaches (and the process) to build a predictive model for the playoffs. We reinforced that re-visiting assumptions and context, cross-checking numbers and validation is important within the predictive modeling process. This helps you check your numbers and think through potential gaps (e.g., why is your model better than the international bookies?).
We then explored three different approaches that you might use (GFPG, PWP, & Bayesian Probability) depending on what you're trying to accomplish. Because we used GFPG to get to 19%, we're going to re-do our predictive model with a modeling approach that is closer to each game.
Where to From Here?
This was the first of four parts in a series. In the remainder of the series, we'll cover:
- Building the exploratory data analysis.
- Re-creating the GFPG predictive model through a better approach.
- Re-deploying the social post with the new predictive model.
Will we find ourselves back with 19%, or will a new approach give us something that more closely approximates the bookies? We shall see!