Predicting the Winner of the 2025 Stanley Cup Playoffs
This is the third post in a four-part series that explores how to create a data story that predicts who will win the Stanley Cup playoffs.
At a Glance
- Use Web scraping to source data automatically.
- Clean, transform and filter the data to your needs.
- Create a ranked prediction list and forecast team matchups.
Introduction
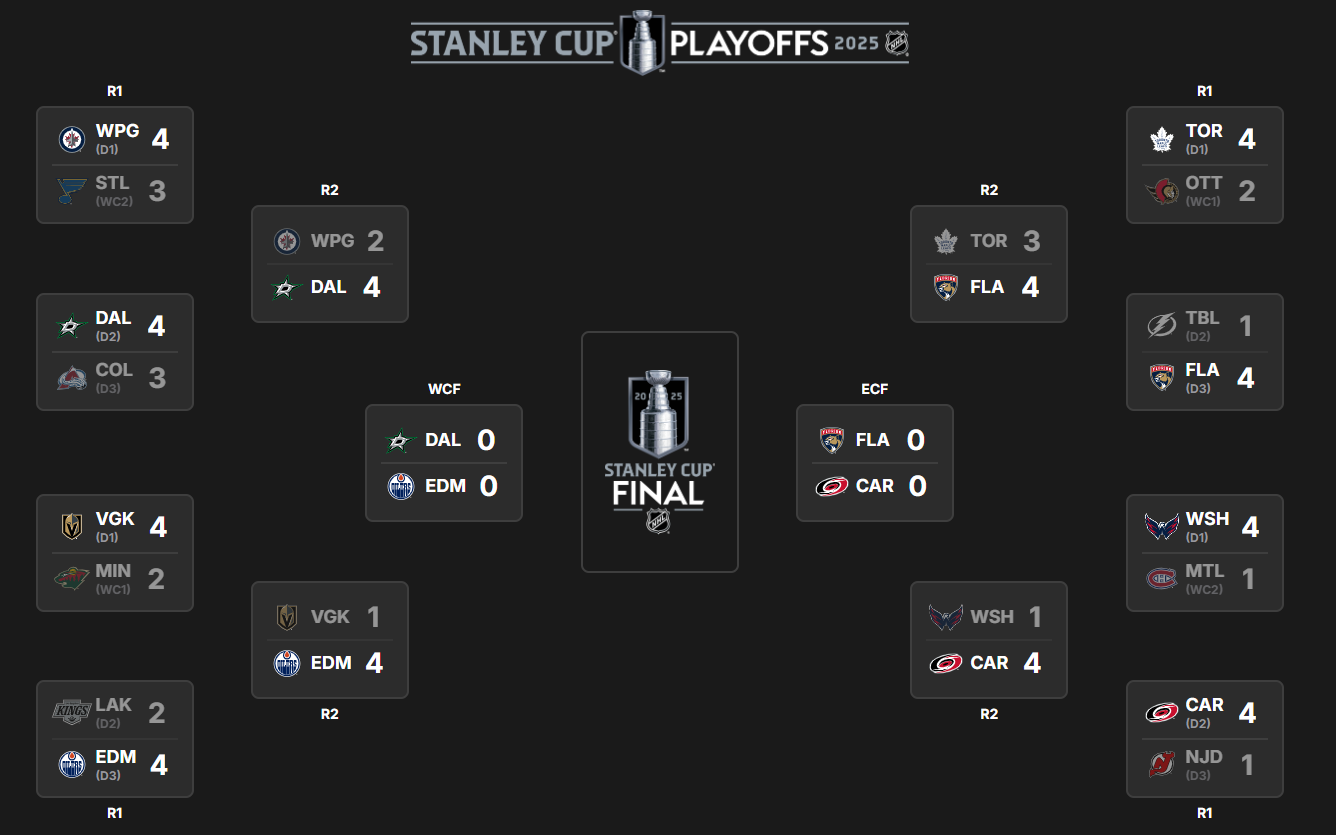
The goal of this four-part series is to break down the original data story, explore areas of improvement and walk through how to do the prediction better. In the first part of this series, we walked through an overview of a data story entitled Predicting Who Will Win the Cup, which is a social post that predicts which NHL team will win the Stanley Cup – shown below. In the second part of this series we gave you an overview of the exploratory data analysis (EDA).
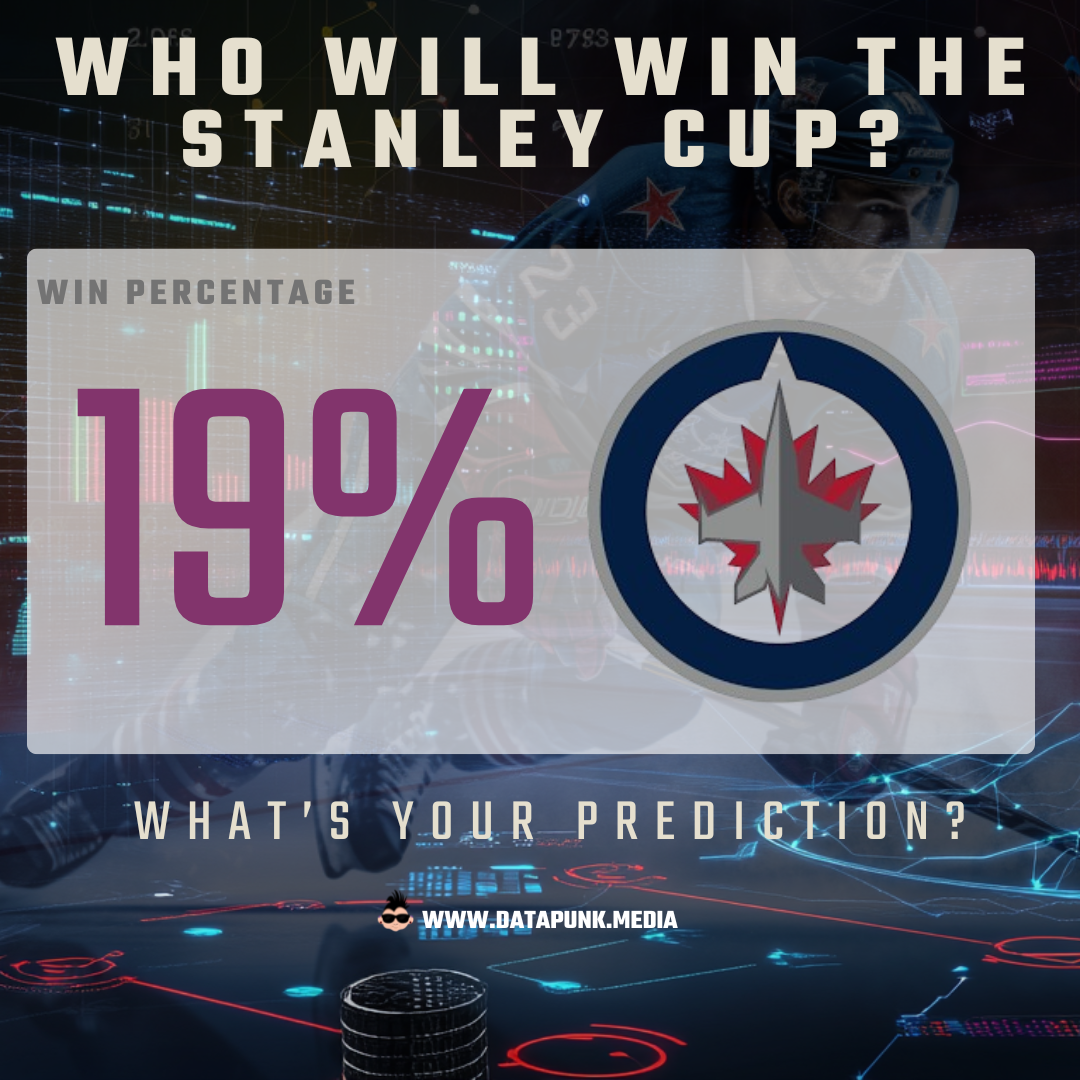
In this part, we'll walk through how to do a basic prediction using Pythagorean Win Percentage or PWP. The original predictive value for Winnipeg of 19% was created using a Goals For per Game (GFPG) model, but we wanted to improve the predictive value lying at the heart of the data story.
Want to learn more about the GFPG, PWP and Bayesian Probability approaches? Check out this YouTube video and newsletter on our companion site Data Punk Hockey.
Data Sourcing, Cleaning & Transformation
When we walked through the EDA, we manually downloaded the hockey data from Hockey Reference. In this newsletter, we're going to use Web scraping to automate the data sourcing, cleaning and transformation.
Sourcing data through APIs or Web scraping enables you to create a data pipeline. However, this requires some coding knowledge in Python and/or R. We'll use R (a statistics and data science friendly language) for this walkthrough and combine the Web scraping, data cleaning/transformation and predictive modeling code in one script.
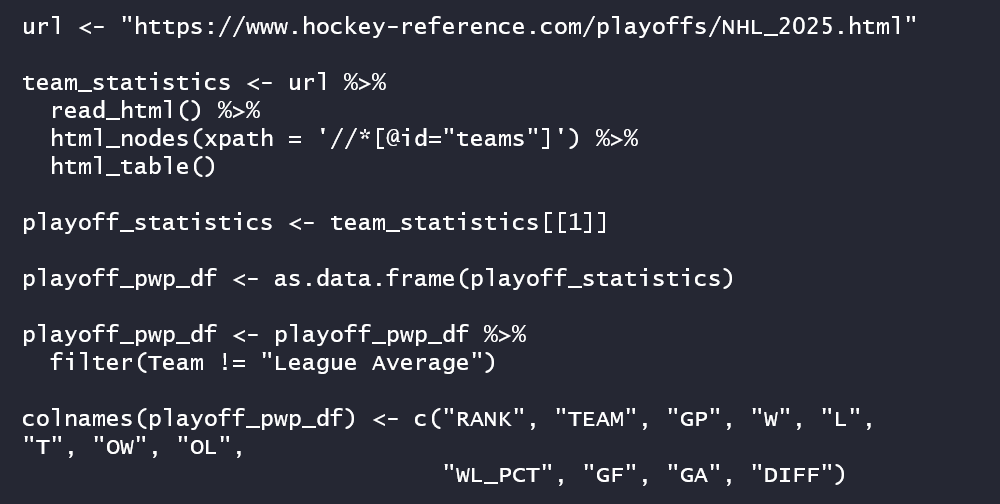
We used the rvest library (similar to the Beautiful Soup package in Python) to retrieve the most recent NHL playoff stats, which we'll use to calculate each team's PWP – the code can be run daily.
The code is relatively short and uses a specific page URL and an XPath string to get the contents of the playoff stats table. We recast the playoff_statistics list as a data frame called playoff_pwp_df and cleaned up the data.
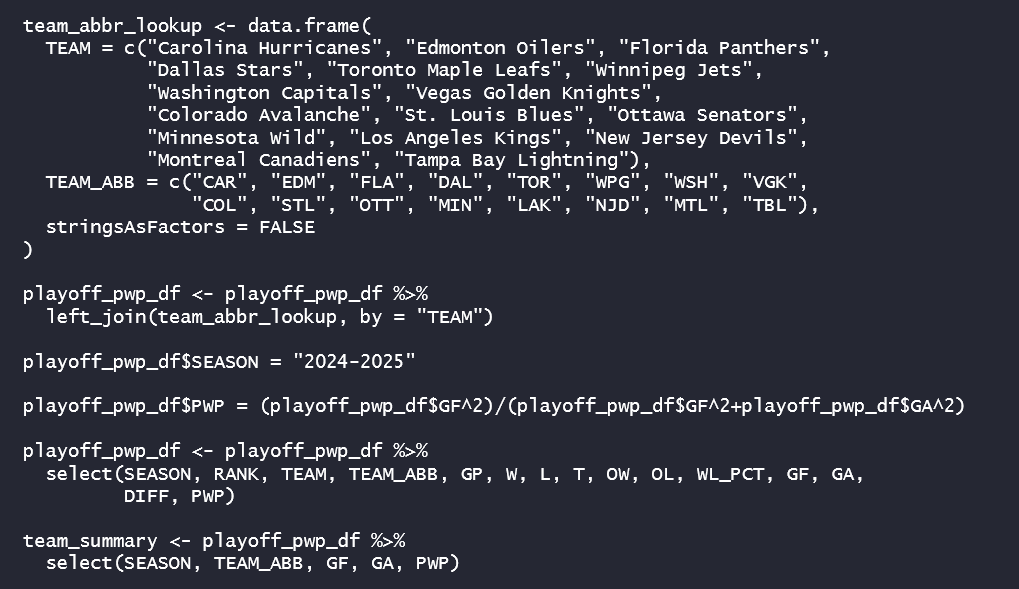
Because the table on Hockey Reference doesn't have team abbreviations, we created a mapping data frame and added a SEASON column and a calculated column for PWP. Also, we reordered the columns in a cleaner way and created a smaller data frame, called team_summary, which we'll use in our forecasting.
We're now ready to move on to forecasting the winners.
Creating the Predictive Forecasts
There are several ways to skin the predictive cat, so to speak. We started with an imperfect model (GFPG) because it was based on the regular season stats – so a snapshot rather than a moving model. Using PWP, you can create an updated forecast after each game.
The steps to do this are:
- Create the PWP using Goals For, Goals Against and a sports-specific exponent.
- Calculate the Win Percentage within a cohort and rank.
- Calculate the Win Percentage between two teams for a matchup.
Now this isn't a fancy XGBoost model, Neural Network or Bayesian Probabilistic model, but it's pretty effective as a way to learn how to build a model.
Brief Overview of Probability
The probability of a random, independent event happening is the likelihood as a percentage that the event will occur. For example, think of a weather prediction: there's a 75% chance of rain tomorrow. In statistical notation, you express the probability of an event happening as P(X) or P(Rain tomorrow) = .75.
The concept of probability in sports is a powerful one and is similar to the weather example. For example, based on a player's previous scoring record, you can calculate their probability of scoring in a game. Likewise, the number of goals a teams scores (and concedes) allows you to calculate a specific type of probability; that is, the PWP.
The PWP approach leverages probability in two ways:
- A calculation of Win Probability (using PWP) for each team.
- A relative probability (Win Percentage) when comparing the PWP across a cohort – which has to add up to 1 across all of the teams.
Using this approach, we can calculate the PWP after each game and then re-rank the teams in the cohort based on Win Percentage. Thus, we have a moving model that can be used for ranking and matchups.
Creating the PWP
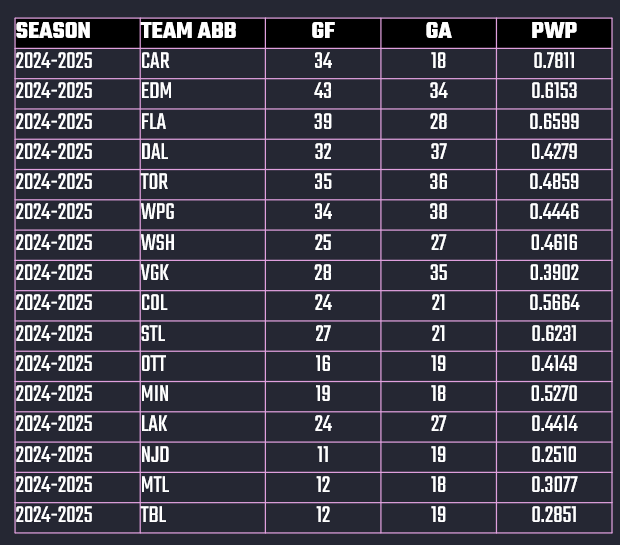
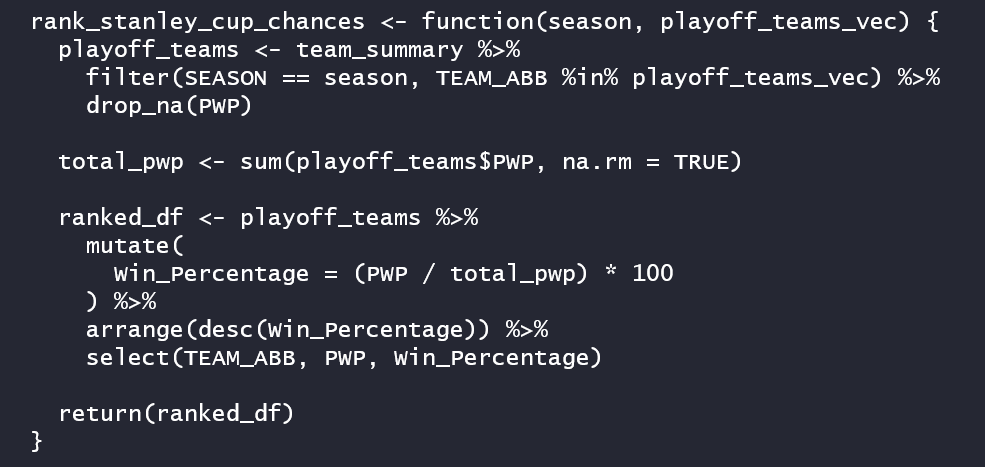
The great thing here is that you've already done this, which is the code snippet below. This calculates the Win Probability and adds a column called PWP to the team_summary data frame.

This table represents the current, daily snapshot of the playoff statistics, which we're using to calculate the PWP. To keep things simple, we're only using the playoff stats.
Calculating the Win Percentage for a Cohort
The PWP represents offensive and defensive performance, so it's a decent way to get a baseline measure. However, we need to translate the metric into a relative Win Percentage. The "relative" part is a comparative for whomever is left in the cohort. For example, at the beginning of the NHL playoffs, the cohort comprises 16 teams and in the next round (Conference Finals), the cohort is down to 4 teams.
We do this by creating a function called rank_stanley_cup_chances that takes a teams vector (the current cohort) and season as input parameters and returns a Win Percentage for each team – relative to the other teams in the cohort.
For example, as of tonight the final four teams in the playoffs are Carolina, Florida, Dallas and Edmonton.
The input list contains the team abbreviations and uses that as a parameter for the function call.

The result gives you the Team (via abbreviation), their PWP and the relative Win Percentage. So, If these four teams play out, then Carolina has a relative Win Percentage of 31.44% compared to other teams in the cohort.
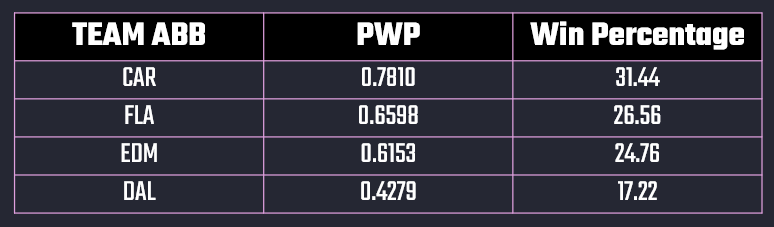
Of course if you were to run this at the beginning of the playoffs, the relative Win Percentages would have been smaller because there were more teams in the cohort.
Calculating the Win Percentage for a Matchup
This gives you a PWP-based forecast that you can use to create fun and engaging social posts. But, let's take it one step further and do a matchup. It's basically a similar concept as above, but the cohort in this case comprises two teams. The below function called head_to_head_prediction is tailored more for two teams as input parameters.
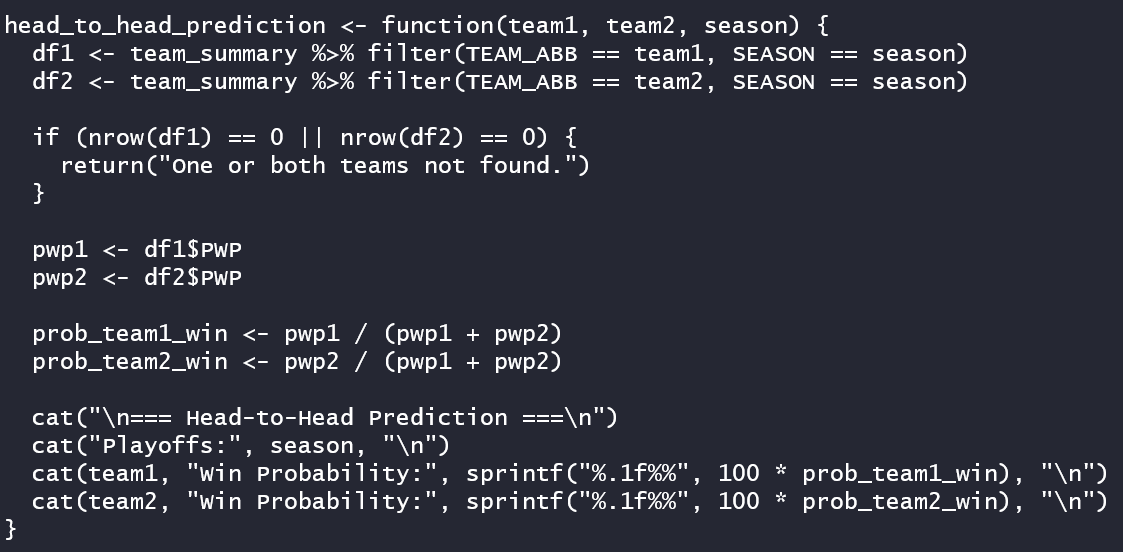
And now that we have the teams for the Conference Finals, let's forecast Carolina versus Florida.

The result (again, using today's PWP as the core predictor value) is Carolina at 54.2% and Florida at 45.8%.

At this point, you can take the Win Probability (aka Win Percentage) and create your data story. With socials, the narrative is more simple – the prediction value, a fun design and some engager text. You can imagine with more complex use cases, the production of content can get equally as complex. But, more on this in our final part of the series.
Summary
This was the third in a four-part series, which focused on the predictive modeling of who would win the Cup. We walked through an automated way to source, clean and transform the hockey data (written in the R programming language) and then walked through the different steps to create the predictive model:
- Creating the PWP using Goals For, Goals Against and a sports-specific exponent.
- Calculating the Win Percentage within a cohort and rank.
- Calculating the Win Percentage between two teams for a matchup.
We used PWP because it's straightforward, creates a decent baseline and can be used as a moving model (or a model that is updated after each game). There are definitely better and more representative models (such as Bayesian Probability), but PWP and Win Percentage will get you started.
In the final part of the series, we'll return to our original social post and re-factor the content. You'll then have a full end-to-end sports example for predicting who will win the Cup!