AI & Data Storytelling: A Practical Guide
This is the third lecture in a ten-module email course to teach creators, marketers, analysts, and journalists how to use AI to build data-driven stories—faster, smarter, and more creatively.
Learning Objectives
- Understand what predicting modeling is
- Be able to build a simple predictive model for sports using AI
- Understand the skills you need (and don't need) to build a predictive model
Introduction
Imagine knowing which athlete is about to have a breakout season – before it happens? What if your story didn’t just explain the past, but forecasted the future?
That’s the power of predictive modeling.
In this module, we’ll walk you through how to use AI to build no-code predictive models in sports — using hockey player performance as our example. Whether you’re creating data stories or content for fantasy hockey, analytics dashboards, or content that stands out on socials, predictive modeling makes your work insightful and forward-thinking.
Don't have time for the article? Check out our quick-hit video below.
What is Predictive Modeling and Why Should You Care?
Predictive modeling is the process of using data to make informed guesses about future outcomes. In sports, that means answering questions like:
- How many goals will this player score next season?
- Will this rookie outperform expectations?
- Is this team likely to make the playoffs?
Predictive models are found everywhere and have increasingly become an integrated part of many professional sports. You can find predictive models in fantasy sports, sports betting, fan engagement, and so on. In hockey, predictive models use past player stats such as points, shot quality, ice time, penalties and more to estimate future performance.
For data storytelling, predictive models can provide you a differentiator by not only showing where a player or team has been, but where they have the potential to go in the future. Thus, predictive models are not just about telling the future; they're also about telling amazing stories.
Great data stories don’t just summarize what happened — they give your audience a peek into what might happen next.
And if you can create robust predictive models that directionally lay a path to the future, then you can build trust and loyalty with your audience as a creator. You become a source of insight, not just information.
Join Data Punk Media today to learn more about how to analyze sports data and predict the next breakout hockey player.
How Can You Create Predictive Models Using AI?
Let’s say you want to predict an NHL hockey player’s Points per Game (PPG) for the upcoming NHL season. What do you do? Where do you start? And how can AI help?
Before you get started, it's helpful to understand what AI needs to successfully create a predictive model.
| Ingredient | Why It Matters |
|---|---|
| Historical Data | Foundation of your model; ideally 2–3+ years of performance stats |
| Target Variable | Define what you're predicting, e.g., PPG, Goals, Total Points |
| Engineered Features | AI works better with ratios, rolling averages, and per-game stats |
| Clean Data | Missing values and outliers will confuse your model |
| Enough Volume | At least a few hundred data points for sports models to be meaningful |
| Defined Purpose | Knowing if you're modeling for accuracy, storytelling, or fantasy edge matters |
Let's walk through the different steps to build a model using ChatGPT and where the above factor in.
Step 1: Gather Historical Data
The first step is to gather the data that you'll use to train your model. Predictive models are based on historical events (so past Points per Game (PPG) for our model).
Ideally, you'll want the last 3 seasons of player statistics: Games Played, Goals, Assists, Points, Time on Ice, Power Play Goals, Expected Goals, and Shots on Goal (at a minimum).
Eventually, you can get more fancy with your models by including the strength of linemates, special teams, and so on. But for today, we'll keep it simple and only focus on the player statistics and a limited number of features.
Step 2: Engineer Features
In the world of data science, a feature is an individual measurable property or characteristic of the phenomenon being observed. In other words, it is an input variable used to make predictions or understand patterns in data – typically a column in your dataset.
In our hockey example, for you to predict a player's PPG, you'll probably want to look at their Shots on Goals, Expected Goals, Goals, Assists, and Time on Ice. When you think about features, ask yourself what would be good, representative observations that would contribute to what you're trying to predict. In hockey, you can't score points if you're not on the ice, you don't shoot, pass the puck, and so on.
Step 3: Train a Predictive Model using AI
After you've collected data and established your features, you'll use a specific type of algorithm to build the predictive model. There is some esoteric knowledge built into this part of the process, so this may be where you let AI do some of the heavy lifting.
Two often used approaches in predictive models are:
- The use of a regression model to estimate a continuous variable like PPG; and
- The use of a classification model if predicting categories (e.g., win or lose).
Because we're trying to predict a player's PPG, we can start with the linear regression model, which will help us paint a future trend for a player.
Step 4: Run the Predictive Model using AI
You can choose to build the model yourself, but this will require some specific machine learning or AI knowledge, or you can choose to ask a took like ChatGPT Advanced Data Analysis to do it for you.
To do this, start a new chat and select the GPT‑4 with Advanced Data Analysis option. You'll see a paperclip icon in the chat interface—this is where you’ll upload files. Here's a prompt you can use:
"Use this data to predict PPG next season based on goals, assists, TOI, and age."
It can create a basic regression model and give you explanations of the result.
Step 5: Discover What's Interesting in the Results
After you have the prediction, you can download the results from ChatGPT. This might be more data or a chart or visualization that shows how a data point will move in the future. You can use these types of output to build your story.
You an also continue to interact with ChatGPT and submit prompts that get at:
- What’s surprising?
- How does it compare to public expectations?
- What’s the confidence range?
However, we would recommend building the muscle of reviewing the output of ChatGPT. Use it as a learning opportunity to understand what a model looks like and then validate the output against your own understanding of the scenario or against other datasets.
Join Data Punk Media today and learn the different ways you can build predictive models for your next data story.
What Data Science Skills Do You Need?
You don’t need to be a machine learning engineer to build a predictive model. But you do need to understand how the AI makes decisions — and how to check its work. For example, there are some key concepts that you should understand when building predictive models:
- Train/Test Split: Divide your data into training and testing groups.
- Overfitting: Is the model memorizing instead of learning?
- Feature Importance: What variables are influencing the outcome?
- Accuracy Metrics: Know how to measure model success.
There are steps in the overall data science workflow that help you manage the above, so if you're not familiar with them be sure to prompt ChatGPT to consider these concepts.
Also, if you're building a regression model, you'll want to be familiar with R² (R-squared), which helps explain the variance in your model and is an indicator of accuracy. A higher R² value can indicate a better, more accurate model.
Even if you use ChatGPT, it's also helpful to be aware of some of the other tools and programming languages (and libraries) out there that are being used for AI. For example, here are some examples:
- ChatGPT Advanced Data Analysis – Upload data, ask questions, and generate models
- Excel + CoPilot – Add trendlines, forecasts, and formulas
- Google Sheets + Gemini – Use prompts for data exploration and forecasting
- BigML – Visual machine learning tool with drag-and-drop interface
- DataRobot – For automated machine learning (great for advanced users with more data)
- Python:
scikit-learn,xgboost,pandas,seaborn - R:
tidymodels,randomForest,caret,ggplot2
We will say that while AI can accelerate the development of simpler models, if you really want to get under the covers with building your own models you'll want to get more familiar with these tools and languages. Learning how to do some programming (with AI as your assistant) will open your world to some pretty damn cool things.
Subscribe today to be the first to access our stories! The past releases can be accessed here.
Walkthrough: Predicting Player Performance
Let's now walk through an example and build a simple predictive model. In this walkthrough, we're going to build a predictive model for Points per Game (PTSPG in the dataset) and then rank the top five player predictions for next season.
You're going to use three tools in this walkthrough:
- Hockey Reference to get 3 years worth of data;
- Microsoft Excel, which you'll use to clean and transform the data; and
- ChatGPT to run your analysis and build your model.
We'll build the predictive model in five steps.
Step 1: Get the Data
You can get player data by the season on Hockey Reference.
You can use the combined_player_data.csv file as the starting dataset to use for the model-building process. We'd recommend trimming the file down to only those columns that you need. For example, we filtered the combined dataset down to the following columns.
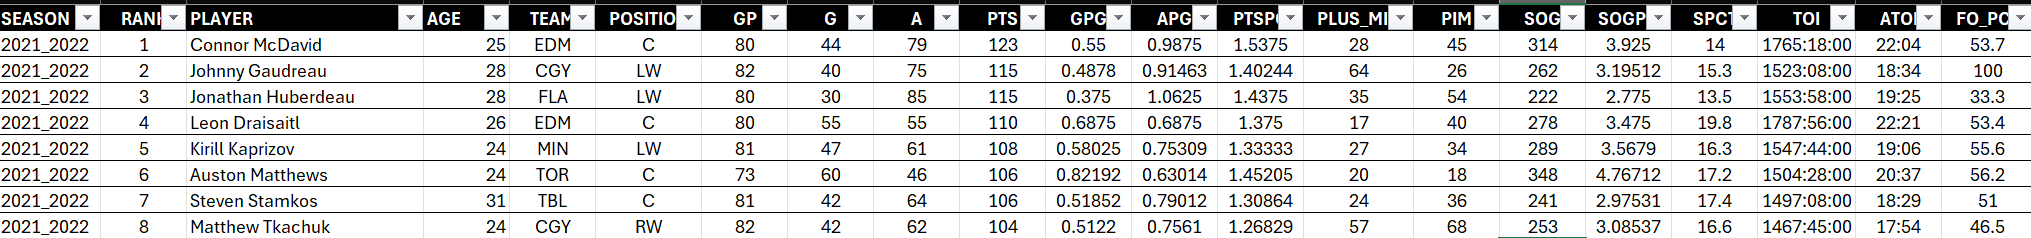
This filtered dataset is available in the repo (filtered_player_data.csv).
Step 2: Engineer Features
This is an integral part of the model-building process. The features will be used as inputs, and if these data points don't have a relationship to the variable or outcome you're trying to predict, then your model accuracy will suffer. You can choose to select your own features, but we're going to test the following variables and their relationship with PTSPG:
- SOGPG - Shots on Goal per Game
- SPCT - Shot Percentage
- PLUS_MIN - Plus/minus of player
- ATOI - Average Time on Ice
These will get you started, and then you can choose to remove or add features to see how these inputs would impact the veracity of your model.
Step 3: Discover the Correlation
The next step is to input the following prompt into ChatGPT. This filters the dataset to forwards only and then runs a correlation analysis. This will discover the strength of the relationship between the potential predictor variables and PTSPG. You'll also note that you will create a heatmap to visualize the correlations.
"I want to create a predictive model, which predicts a player's ability to product PTSPG (Points per Game). You'll use the attached dataset. But, first filter the data to only include forwards (POSITION = C, LW & RW). And before you create the predictive model, run a correlation analysis between ATOI, SOGPG, PLUS_MIN, and SPCT with PTSPG. Create a heatmap to illustrate the strength of the relationship between the four variables and PTSPG."
The following heatmap is what is produced by the above prompt, along with a short explanation of the strength of the variables with PTSPG. Note that ATOI results in 0.84 and SOGPG results in 0.81.
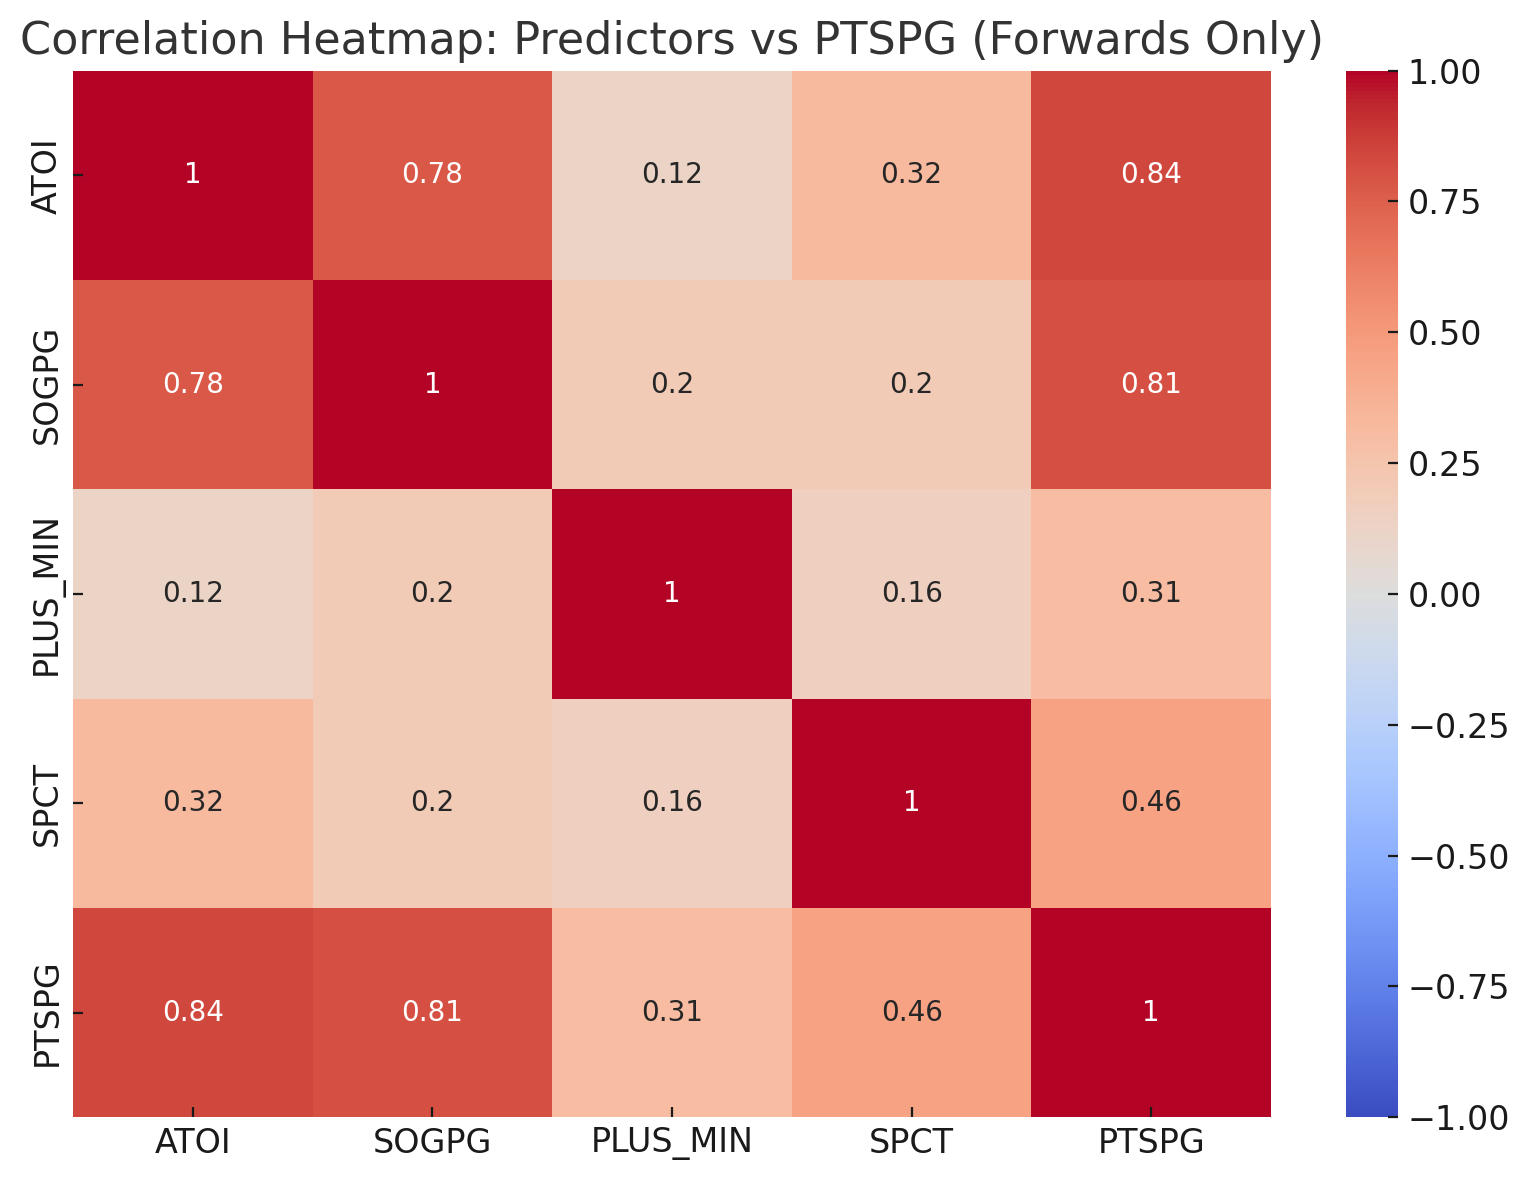
These are strong results, so we're going to include these two features in our predictive model.
Step 4: Train & Validate the Model
We'll now train the model using the four seasons worth of player data. Note that we only want the forwards for this model because we know defensemen tend to score less on their shots (and have higher playmaking production). The following prompt builds the linear regression model.
"You'll now build a linear regression model using ATOI and SOGPG to predict PTSPG. Create the model in a standard way, splitting the data across training, test and validation. Be sure to show the results of the model, using R Squared to illustrate the strength of the model. Be sure to only use forwards (so POSITION = C, LW & RW) as data points in the model."
After the model has been built, you should see the performance of the model.
Model Coefficients
- Intercept: -0.463
- ATOI Coefficient: +0.00076
- SOGPG Coefficient: +0.1564
Model Performance (R² Scores)
- Training Set: 0.772
- Test Set: 0.750
- Validation Set: 0.753
Interpretation
- The model explains ~75–77% of the variance in PTSPG across all splits.
- SOGPG is a stronger contributor than ATOI, based on the size of the coefficient.
- The model generalizes well, with consistent R² across test and validation sets — a good sign of no overfitting.
After ChatGPT creates the model, it will likely ask you if you want to visualize the results. Assuming you say yes, the below is what you will see.
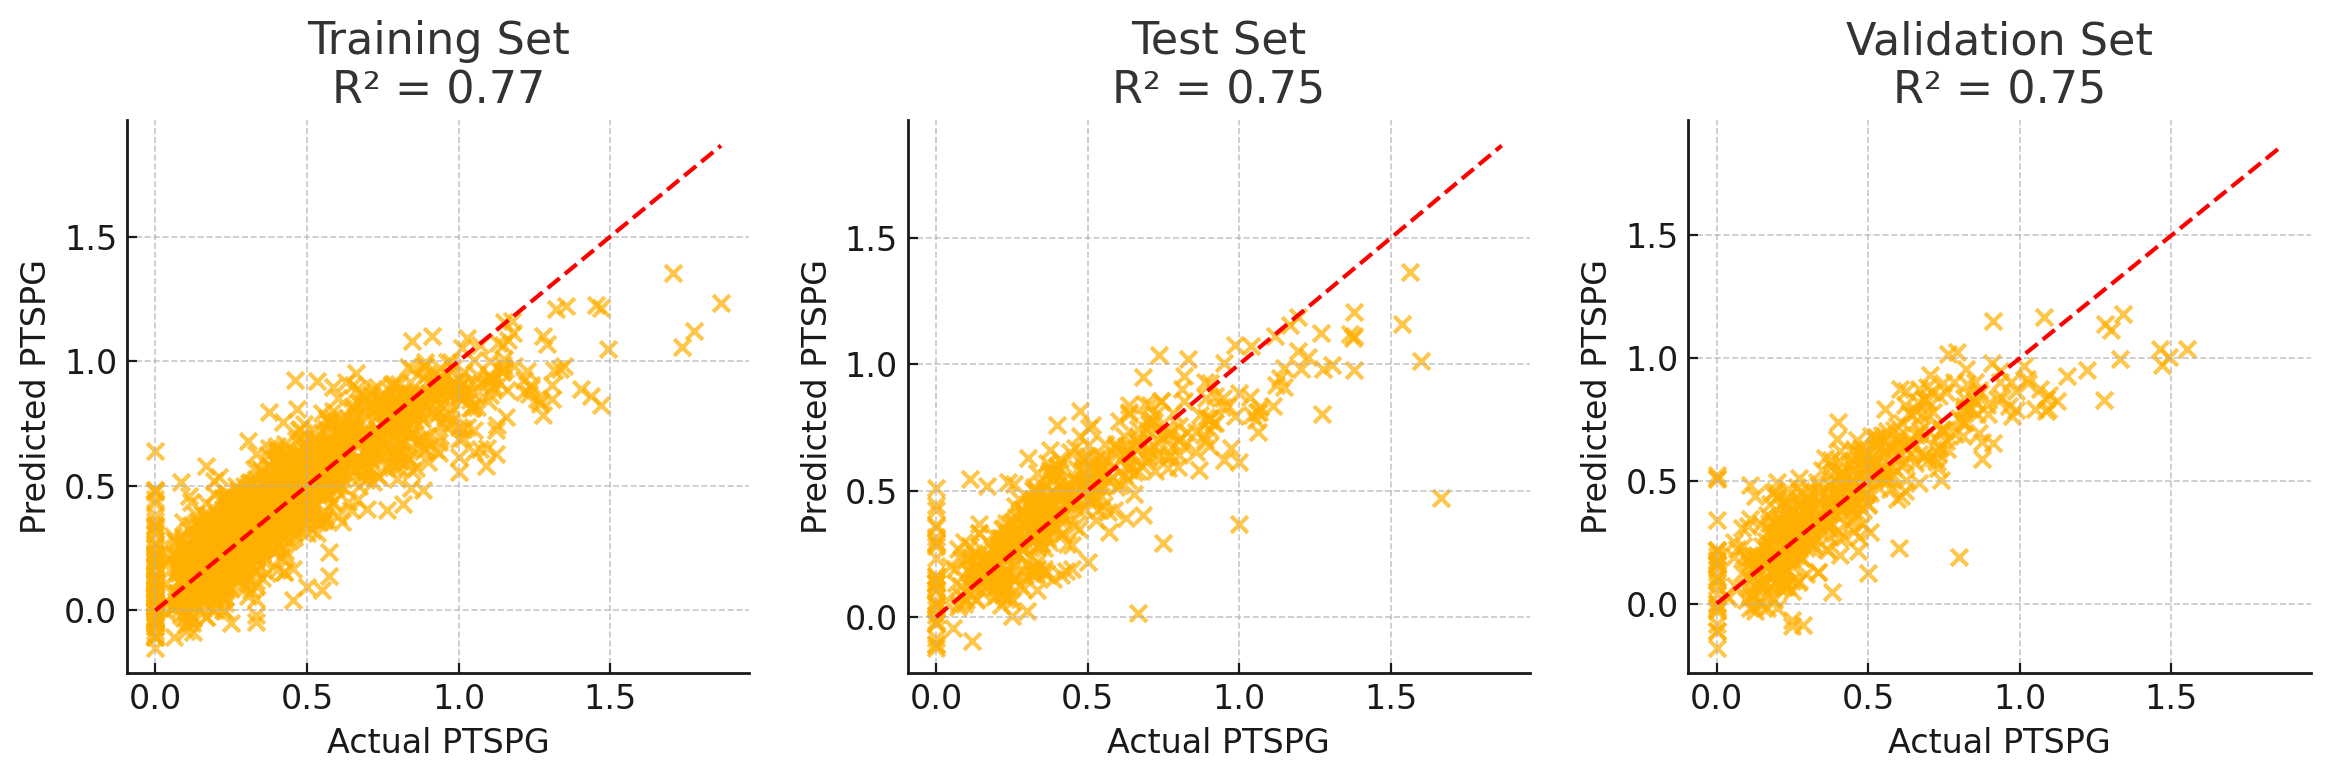
The scatter plot above shows the predicted vs. actual PTSPG (Points per Game) values for the training, test and validation sets using ATOI and SOGPG as the predictors:
- Each point represents a player.
- The red dashed line indicates the ideal 1:1 relationship between predicted and actual values.
The clustering around the red line suggests the model performs well in predicting PTSPG based on ATOI and SOGPG.
Step 6: Find the Story
You can now look at the stats in any number of ways. For example, you could:
- Find the top five point-producing players using the predicted PTSPG value;
- See how the youngest players will fare in the next season; or
- Explore the data for outliers.
Using the linear regression model, the top five point-producing players for next season are as follows:
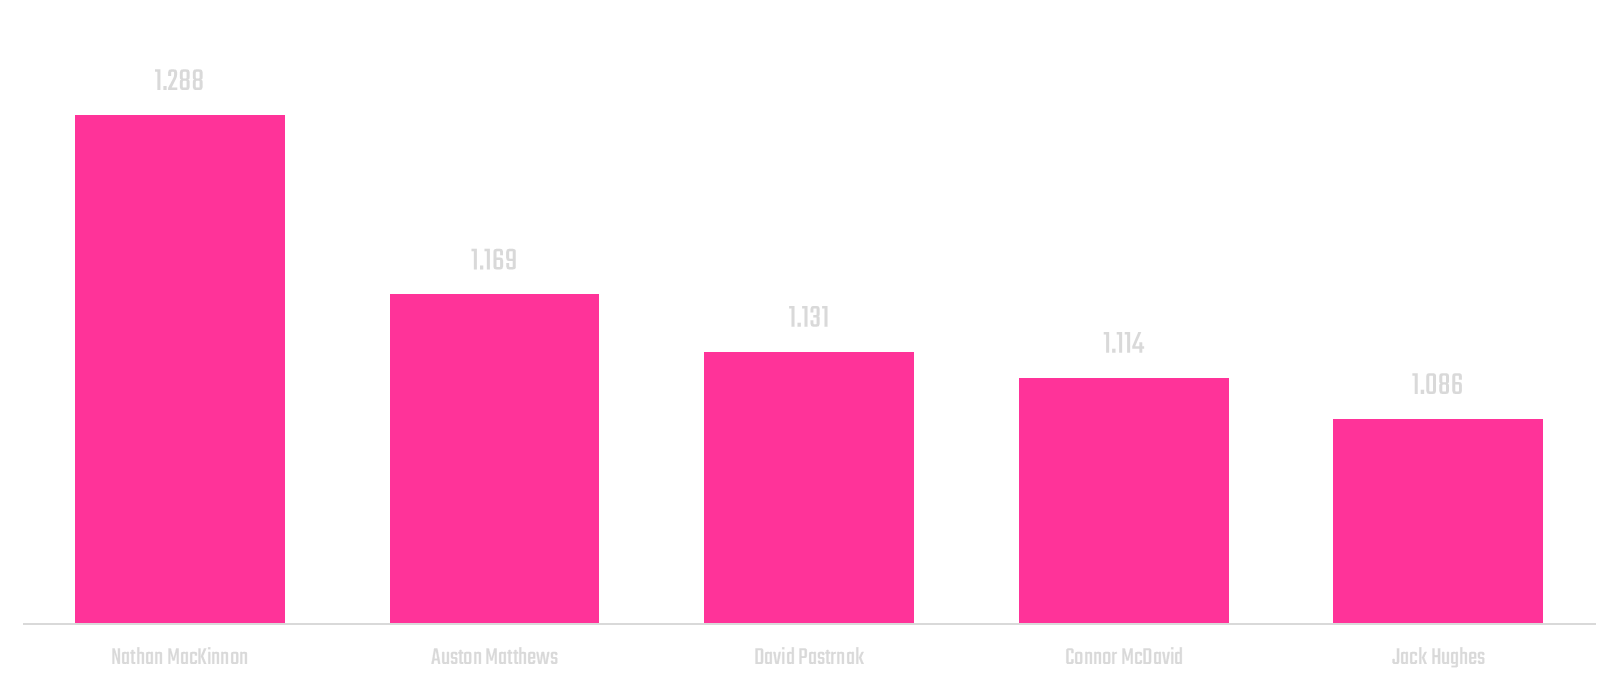
All that said, your story here could be that Nathan MacKinnon is predicted to be the top scorer in the next season. More formally:
“Based on his ability to attack the net while on the ice, Mackinnon is projected to average 1.3 PPG next season — putting him at the top of the elite NHL forwards."
Summary
This module walked through how to build a predictive model using AI. We sourced the data using Hockey Reference, cleaned and combined four seasons into a single dataset to train and test the model, ran a correlation analysis to find variables with positive relationships to PTSPG, and then built a linear regression using ATOI and SOGPG.
The predictive model used Shots on Goal per Game (SOGPG) and Time on Ice (ATOI) as the input variables and produced a strong predictive model. When we applied the model, we then discovered the top five point-producing players next year – based on the model. And then created a story around Nathan MacKinnon being next season's top point producer.
Predictive modeling gives you an edge as a content creator. And AI can help you gain that edge. You don’t need to code everything from scratch. However, you do need to ask smart questions, prep clean data, and understand what your model is saying. This means having some underlying data science knowledge is helpful.