Helping You Translate Stats into Stories
We teach creators, analysts, and journalists how to turn data into stories people actually read, watch, and share.
What is Storytelling with Data
Data storytelling is the art of blending narrative techniques with data science and analytics to communicate insights in a clear, engaging and persuasive manner.
Data storytelling has its roots in Data Journalism and has evolved into telling a story with visualizations.
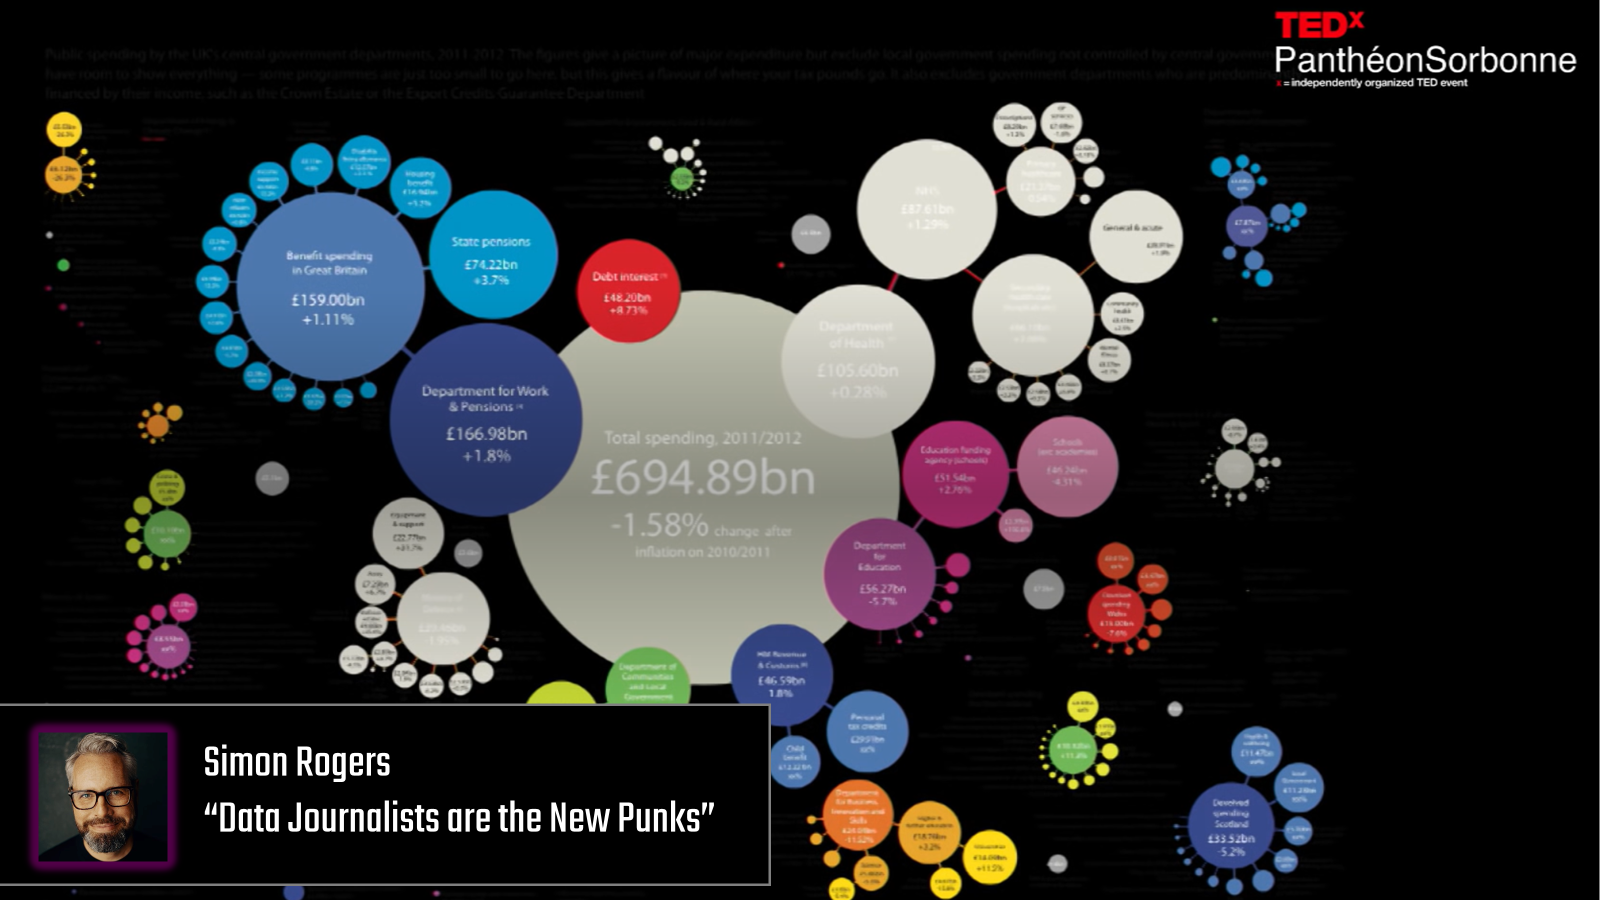
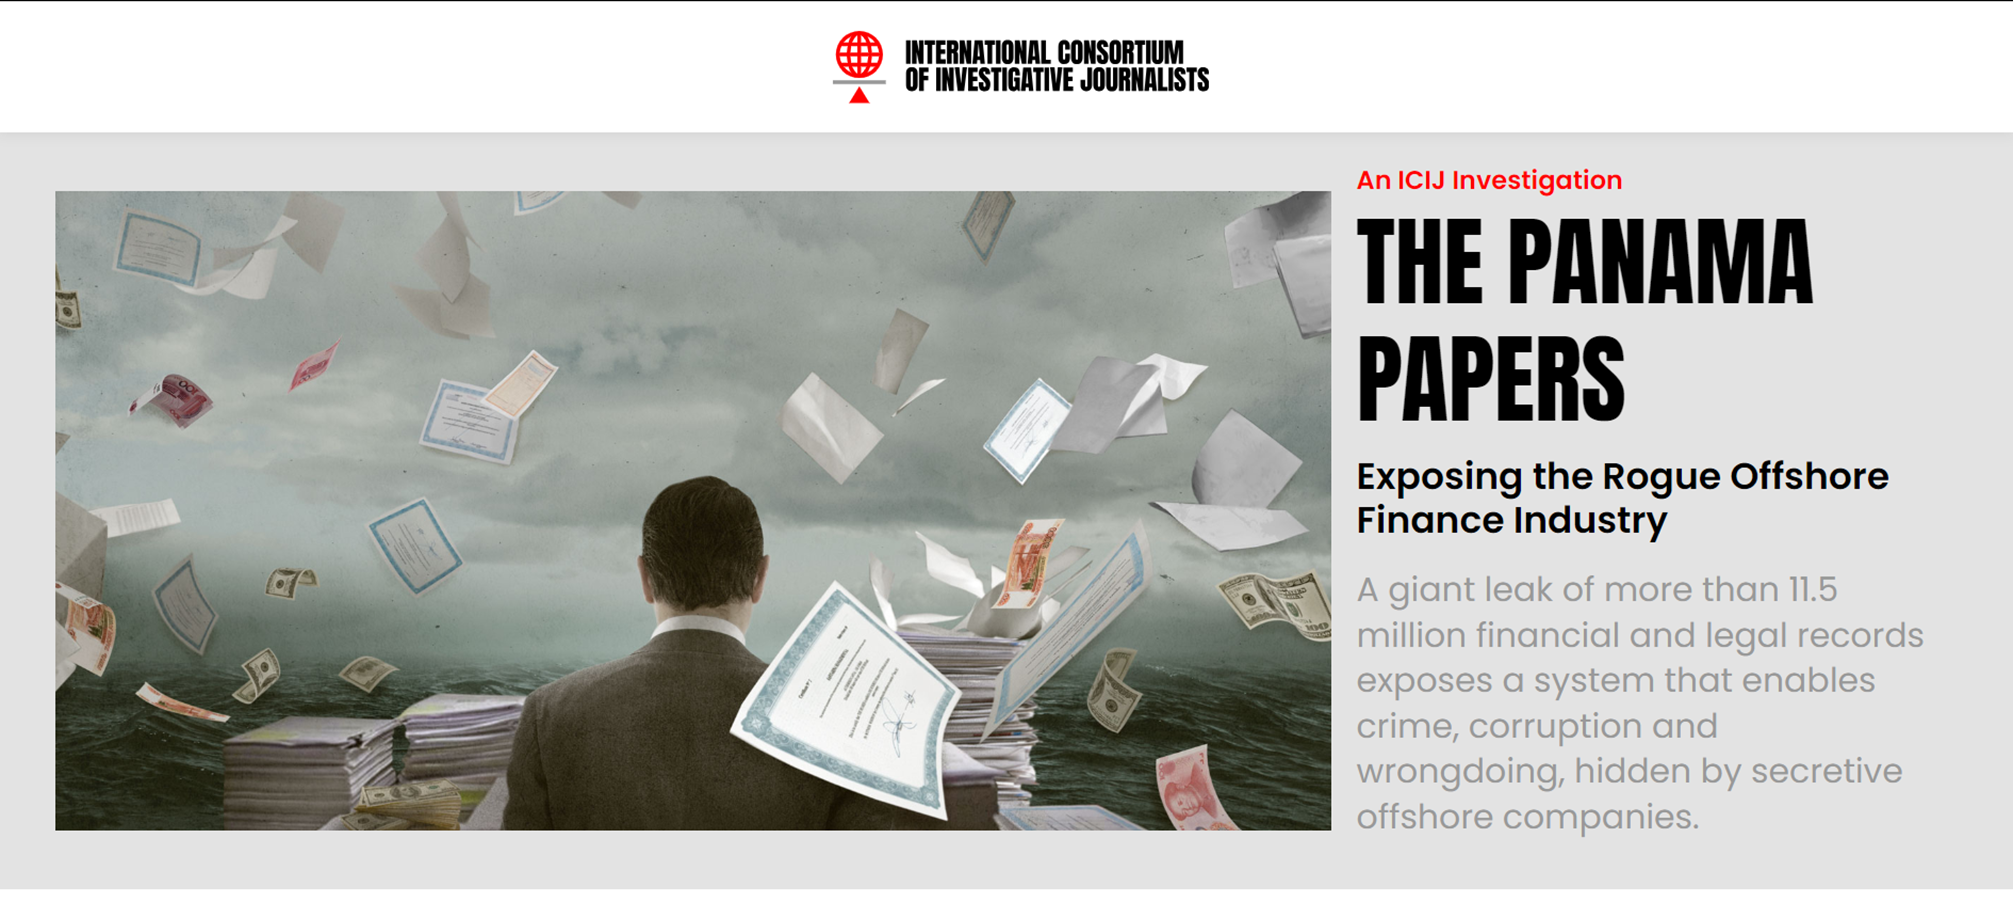
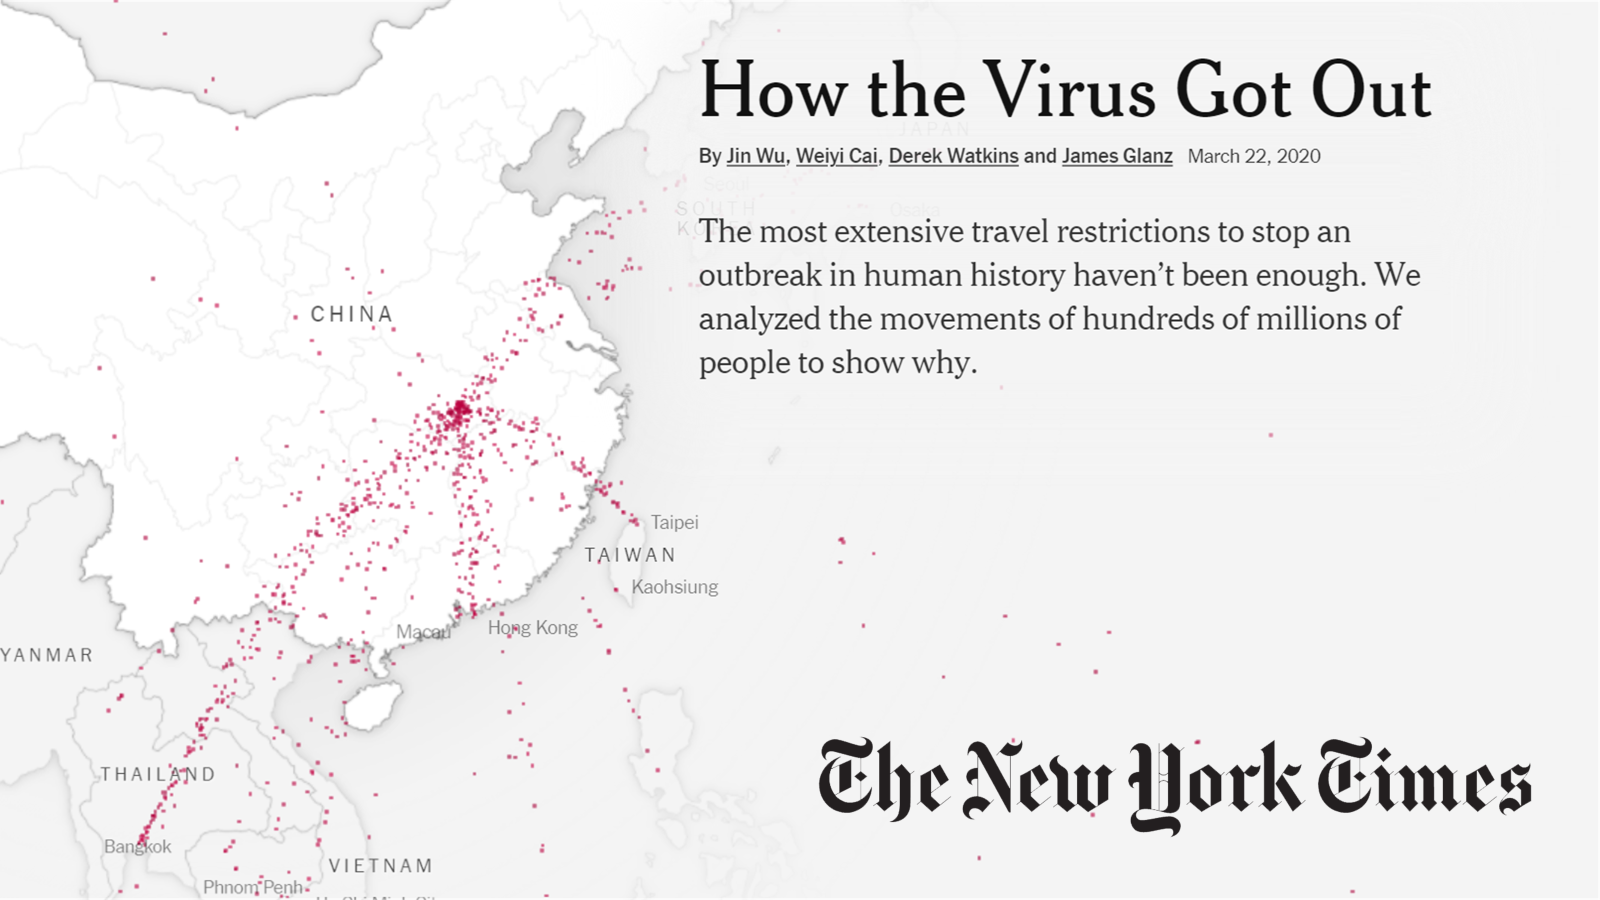
You can also find data storytelling in investigative journalism with stories such as The Panama Papers and How the Virus Got Out.
While its roots are in data and investigative journalism, data storytelling shows up everywhere:
- Sports analytics
- Investigative reporting
- Creator content
- Business and marketing
And the independent media – all you creators out there – is growing exponentially powered by data storytelling.
What We Offer
Data Punk Media (DPM) is a learning platform built around storytelling with data for sports, business and entertainment.
Through DPM, we have three offerings.
1. Free Content
We publish a regular newsletter and courseware that is freely available. Check out the Get Started and Resources page to learn more.
Want to get notified when new content drops? Join for free today!
2. Premium "Living Course"
Data Punk Media is a learning and platform built around Sports, AI and Storytelling.
At the center is our Living Course — a continuously updated course that combines:
- Clear foundational concepts and frameworks on data storytelling
- Monthly, real-world data stories tied to current events
- Companion modules that explain how those stories were built
- Data, code and templates that you can use to build your own stories
This is not a one-and-done course; it grows with you.
Ready to sign up for the premium experience? Click here and select the monthly paid or yearly option. You can level up from free and opt out at any time!
3. Training & Custom Projects
Do you or your team need training? We offer generic and bespoke workshops for you and your team.
If you need training, you can opt for one of the following:
- Free community calls on pre-defined topics
- Live webinars on pre-defined or bespoke topics
- Virtual team training
Want more information? Check out our Offerings page or reach out to us for more information.
How are We Different
It's About You!
Our motivation is you and your success. We bring decades of experience to this space and want to guide you through a system that will lead to you saving time, creating better stories from stats, and monetizing from your efforts.
The Full Lifecycle
Our main focus is on the intersection of sports, data science and storytelling – though we also dabble in entertainment and business. And another key differentiator is that we cover the full lifecycle.
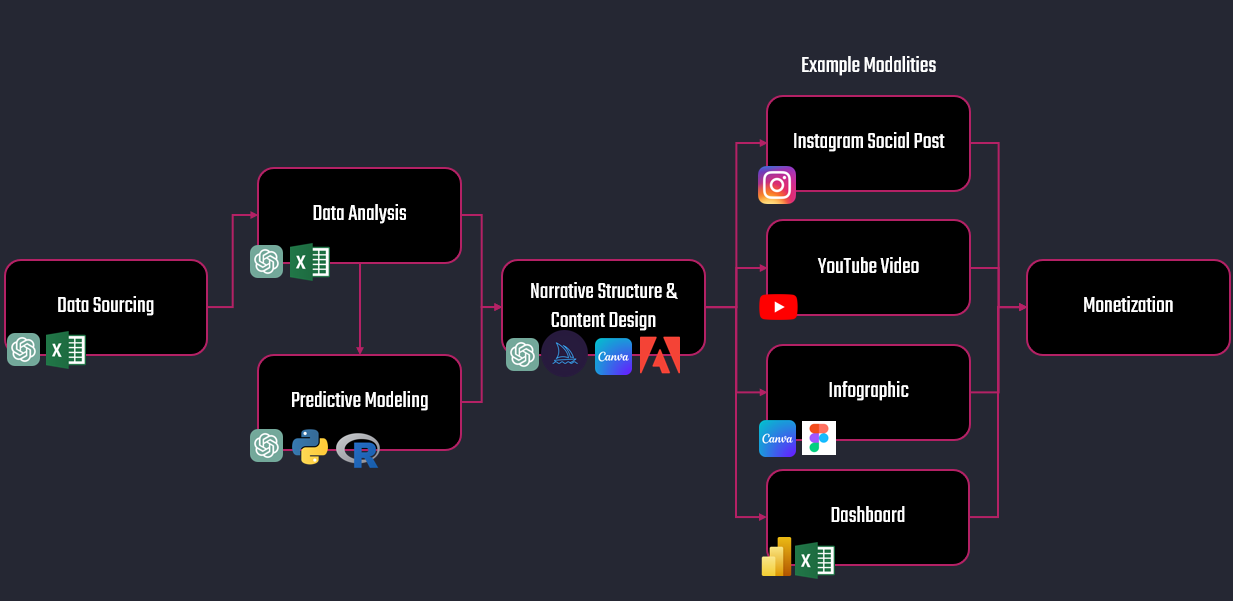
Question → Data → Insight → Narrative → Visuals → Publish → Monetization
To help you navigate the complexities of creating and publishing data stories, we created the data storytelling framework. This framework guides you on the entire life cycle – from data sourcing, analysis and predictions all the way through to publishing to different platforms and modalities (e.g., socials, infographics, videos, and scrollytelling).
Through the framework and our offerings, we'll help you to:
- Stop over-explaining
- Stop hiding behind complexity
- Stop producing work that gets ignored
Instead, you’ll learn how to:
- Ask better story questions
- Decide what data actually matters
- Communicate uncertainty clearly
- Choose visuals intentionally
- Publish confidently across platforms
- Better engage with your audience(s)
- Monetize your content
These are skills that transfer across sports, business, and entertainment.
Example Stories
If you're completely new to data storytelling, here are three examples of stories we've produced using the storytelling framework.
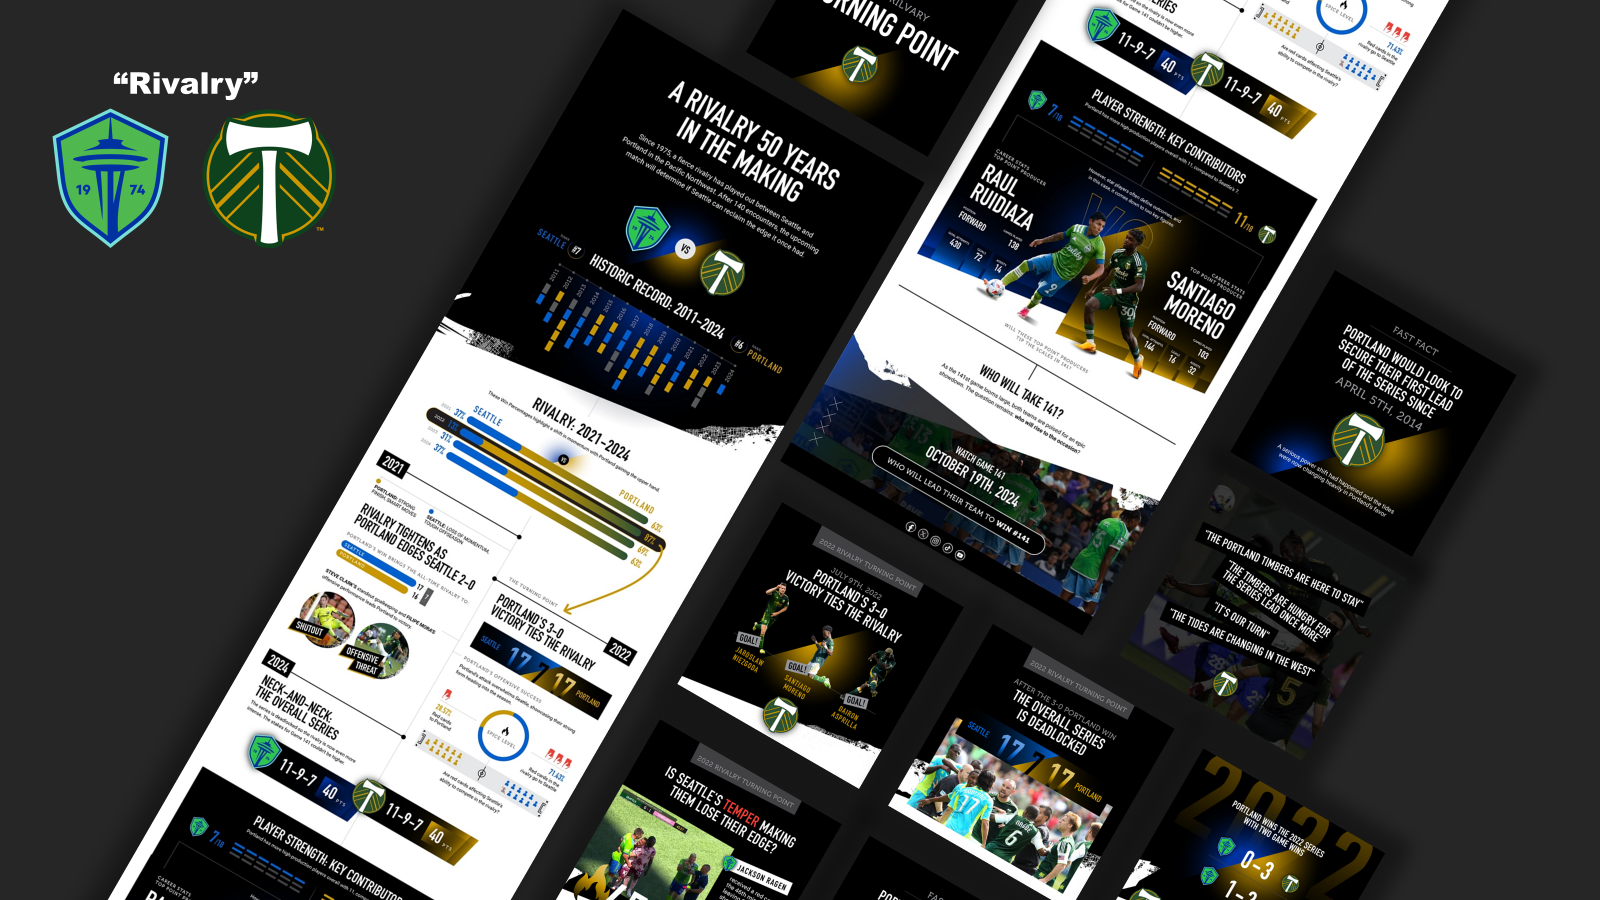
"Rivalry - 50 Years in the Making"
The Rivalry project resulted in an infographic, social posts and templates. It focused on the 75 year soccer rivalry between Seattle and Portland.
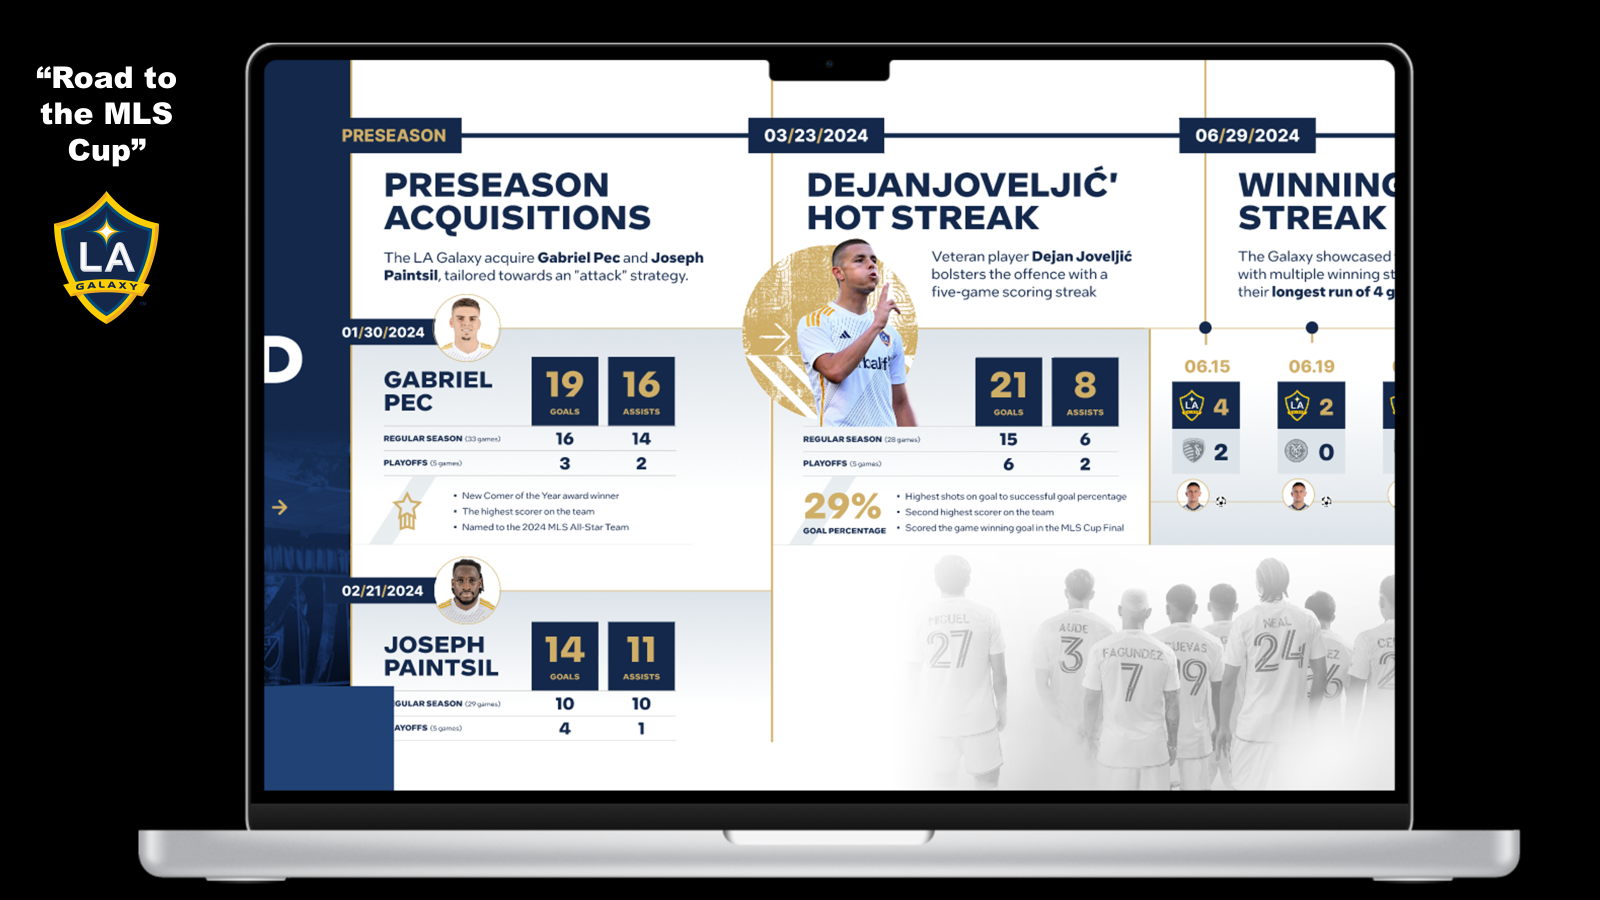
"LA Galaxy - Road to the MLS Cup"
The Road to the MLS Cup project resulted in socials and an infographic. It chronicled the rise of the LA Galaxy in a season where they started lower in the rankings.
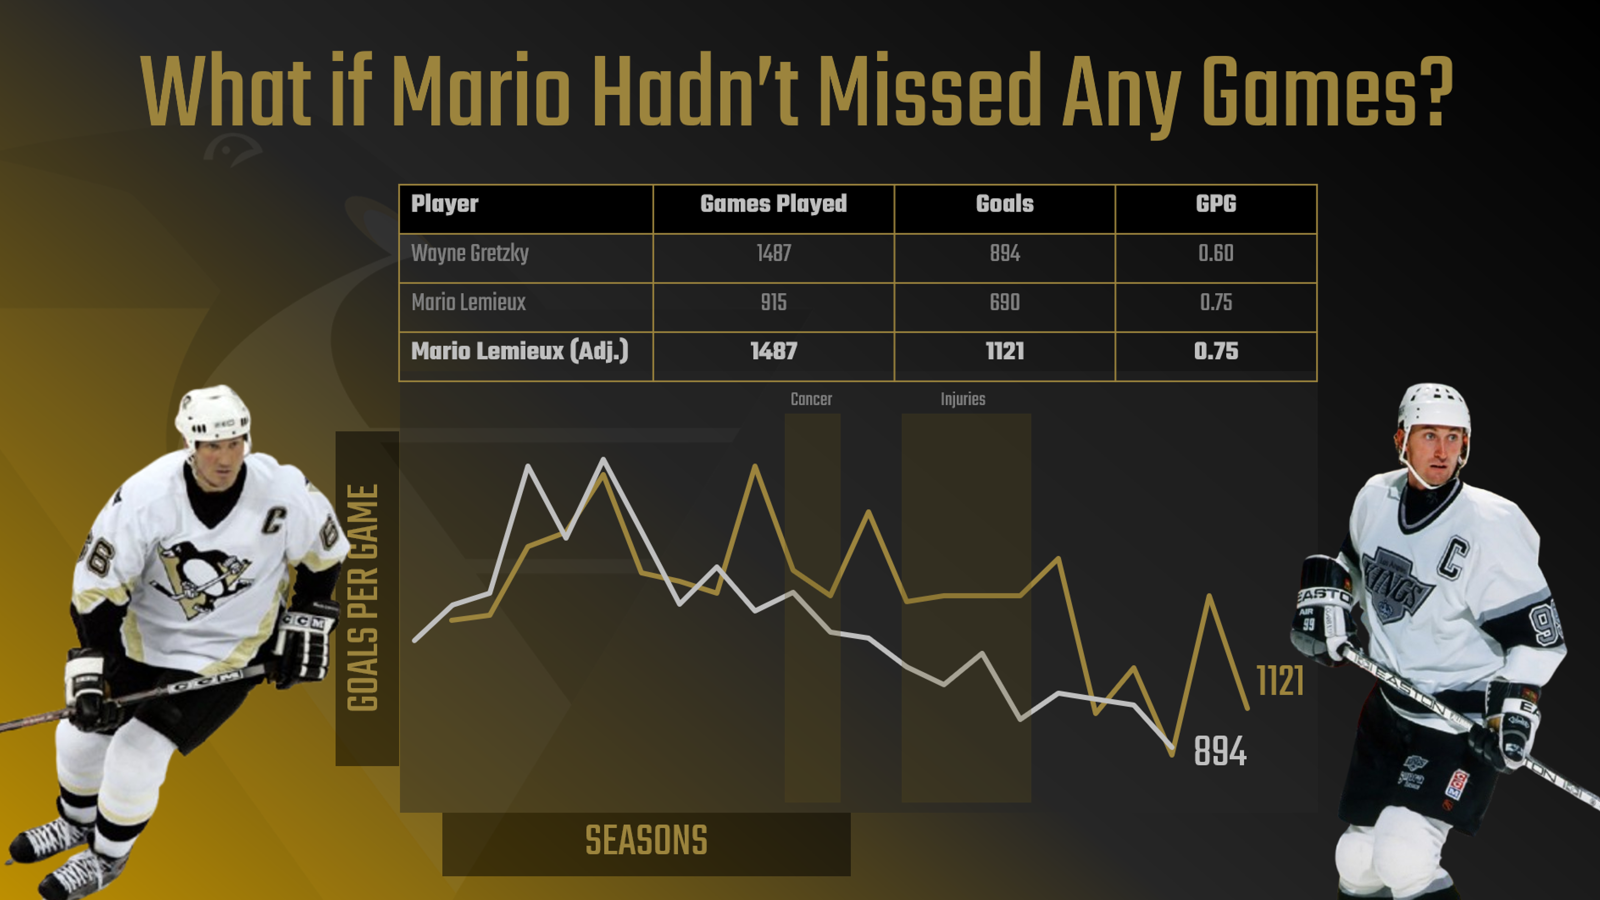
"What if Mario Hadn't Missed Any Games?"
This project resulted in a social post that highlighted Mario Lemieux's accomplishments. It did this through the lens of him not missing any games and a comparison to Wayne Gretzky.
Want to see more examples of our work? Check out the Stories page.
Who are We
We are a small, worldwide team composed of passionate Product Managers, Engineers, Data Scientists, Designers and Storytellers.
Our mission at Data Punk Media is to be educators and practitioners. We create data-driven stories for ourselves and our customers and then bring the learnings to you, our community (representing over 30 countries).
You can reach out to us anytime via mail. You can also find us on:
- Instagram: www.instagram.com/datapunkmedia
- YouTube: www.youtube.com/@imadatapunk
- Luma Community Calls: https://luma.com/datapunkmedia
We publish our monthly stories on our Stories page, so be sure to check those out.
Why are we Doing This
The biggest reason is because we love operating at the intersection of data science and storytelling.
The second reason is that there is a massive opportunity with the creator economy, and storytelling with data will be front and center through content creators, independent journalists, marketers and advertisers, and more.
The creator economy brings together more than 50 million creators. In 2024, the creator economy was worth $156.4B. By 2030, it'll be $528.4B.
And we want to bring this opportunity to you!
Ready to jump in? Check out our Get Started page.