In this Newsletter
- Overview of the Data Storytelling Process
- Breaking it Down
- Data Storytelling Process Skills Matrix
Overview of the Data Storytelling Process
As we mentioned in our newsletter entitled What is Data Storytelling, our focus on data storytelling is a little different than other practitioners. This is mainly because we're drawing on our skills set where we have experience and we're enjoying playing in the following areas:
- An evolving media environment that is witnessing the growth of independent journalists (e.g., data and investigative journalists) and social content creators (e.g., YouTubers, TikTokers, etc.).
- A space where data storytelling requires a broader set of technical skills – e.g., data skills, machine learning and AI, content production, and so on.
- Within a global community that is looking to upskill their tradecraft in specific technical areas – and generally wants to do good things for humanity.
By taking our skills in data, AI and media production within the above, we've managed to create a process from our projects. These projects have varied in size and scope, but the process has remained largely similar.
In smaller projects, some of the steps are less complex, lighter and in some cases not needed. But, in larger projects we tend to see many of the steps we'll discuss come together – along with the need to manage them within a globally distributed team. In short, the process scales up or down depending on the project.
Data Storytelling Process Steps Explained
Our process comprises multiple steps. We have generally found a linearity to the process; however, you will at times back-track or re-visit other steps as you build out your data story. For example, you may find that you start with a goal and hypothesis at the beginning of your data story project, but as you progress the more research you consume, data you analyze and experts with whom you consult your hypothesis and goals shift. This is normal. Point is, don't think of the process as strictly serial.
What's also useful to call out is that our data story projects tend to be broader than storytelling through a single visualization. That is, we've managed and implemented a variety of projects. Examples of our projects are as follows:
- Visualizations within presentations, where the visualization represents the data story.
- Data-driven marketing content, where a narrative through images, slides, etc. is wrapped around the data.
- Online articles, where multiple visualizations are represented within a text-based narrative.
- Short videos, where the data story is told through stitching together a video-based narrative with compelling analytics.
If you compare the above projects, the visualization within presentations is on the smaller side. However, the short videos require more time and effort with a broader set of tools and skills.
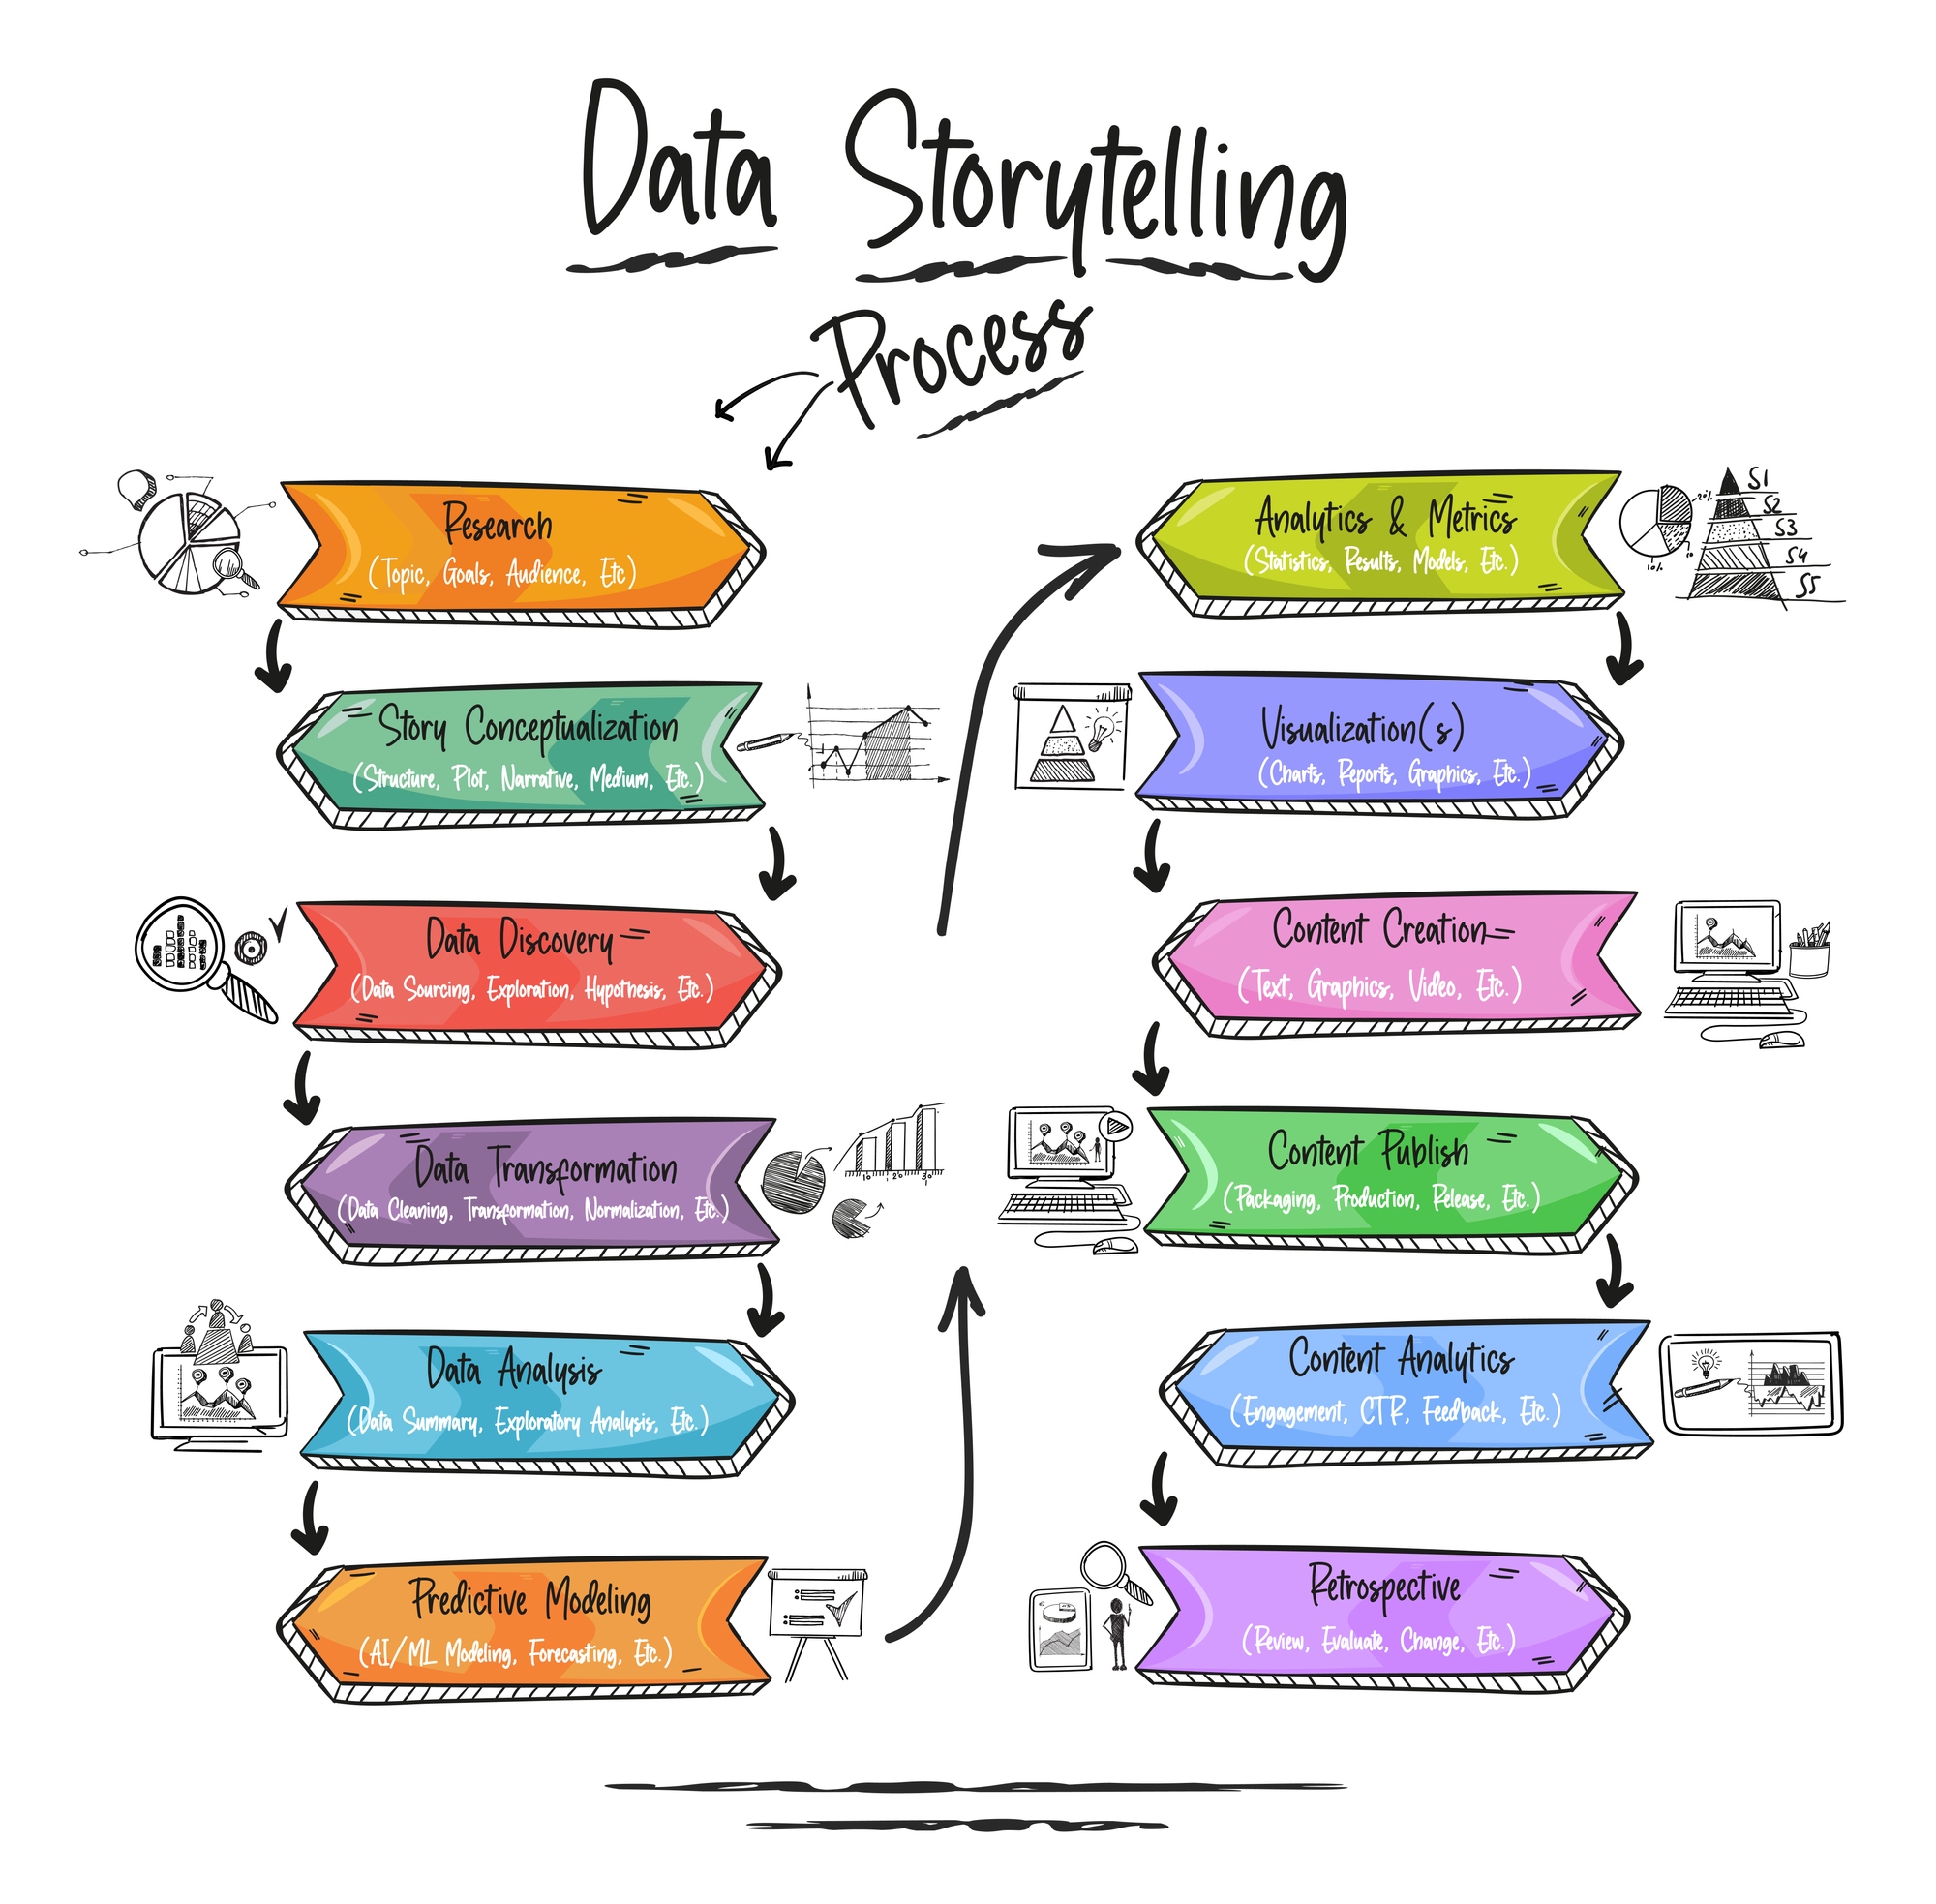
The following diagram illustrates the steps we have incorporated into our data storytelling process.
Breaking it Down
We think about each step as working independently, but integrating with other steps in the process. This is for two key reasons:
- You can focus on the specific elements required in a single step without losing yourself in the overall project.
- If you have a team, you can naturally break out the steps into a workflow, drive specific skills for that team in those areas and run the steps in parallel.
Also, while this process works for us, you may want or need to expand or change certain parts of the process. We encourage you to do this. Think of the process as a guideline to build and deploy your data story. What we outline has worked for us.
At a high level, each step in the process can be described as follows.
Research
At this stage, you typically select a topic, define a goal for the data story, identify sources, and define a hypothesis. We look for related materials and research sources, experts who may be able to help inform our thinking, and generally anything that can help shape our thinking and balance our biases.

Story Conceptualization
This is where you create an initial story frame, structure and plot, think about characters (e.g., antagonist, protagonist, etc.) and decide on a medium or platform. You will likely come back the story conceptualization up and potentially until you've completed your data analysis. As you research, source and analyze more data and sources, you'll shift your frame for the data story and deepen your understanding of the problem space.
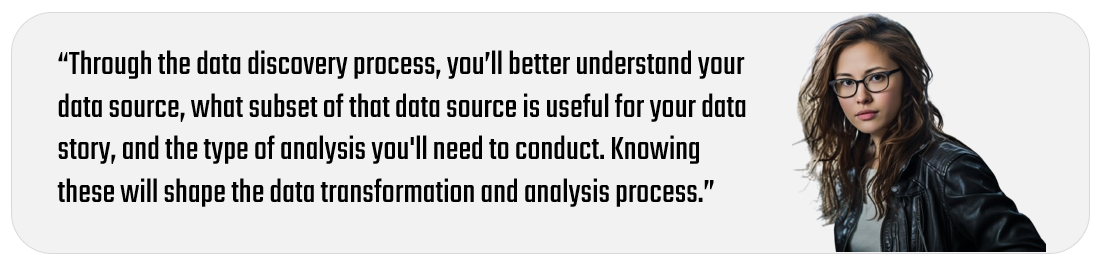
Data Discovery
At this step, you source (0r collect) your data, explore it at a high level, look for high-level patterns and trends, and revisit your hypothesis (and update the story conceptualization if needed). We have some standard analytical practices here that are light (e.g., sorting, filtering, creating pivot tables, etc.) but give us hints about whether our hypothesis will prove out or we need to do additional research. Note that we leave the analytical heavy lifting to the Data Analysis phase.
Data Transformation
This step is where you will shift more into a technical process; that is, here you create a copy of the dataset, clean, transform and normalize the data, and make sure it's prepared for analysis. You might also use special tools and programming languages here.
Data Analysis
Here is where you summarize the data with descriptive statistics, conduct an exploratory data analysis (EDA), and look for inferences, deeper patterns, trends and outliers. We've seen customers move really quickly through this process, but this is where you want to take the appropriate time to analyze your data. Be sure your analysis approach and results are correct (especially for what you are trying to do). This means selecting the right statistical method and tools for your analysis.
We also recommend some manner of triangulation, so you don't just run the analysis once and call it a day. Cross-validate the analysis, so your data story holds up to scrutiny from your audience.
Predictive Modeling
Here is where you need specific technical, programming and statistical skills. At this step, you prepare data for modeling, decide on the appropriate algorithm and approach, and implement predictive modeling using machine learning, AI or other techniques. You may find this step is optional for your project; that is, a summary may actually be enough for your data story. That said, predictive models and approaches are getting much better and accurate, so having both a summary analysis (which looks back historically) and a predictive forecast (which looks forward) gives your data story the flexibility to assert claims like "it's a problem now, and will continue to be a problem into the future."
Analytics and Metrics
If you've done an exhaustive analysis and even done some predictive modeling, you'll have lots of numbers, statistics and metrics to potentially use. So, at this step, you derive meaningful results from analyses and modeling, create a flow across them, and state in the form of an analytic or metric. You should be thinking about what can carry your story; what could be represented at a high level statistically, but have deep implications; and what metrics or analytics would be impactful for the story and to your audience.
Visualizations
This is where you move from the analysis phase into visualizing the data. You may decide to use a tool, e.g. Power BI or Tableau, a framework, e.g., High Charts, D3, etc., or a programming language, e.g., R, HTML/CSS or Python. Either way, at this step, you sketch out and create visualizations for the analytics/metrics, format them towards best practices, and implement them using the appropriate tool, framework or programming language. Here again you may find yourself requiring specialty skills.
Content Creation
If you only need a visualization, this step might be lighter for you. However, if you're creating an online article or a YouTube video, then this step will entail more time and effort. That said, at this step you write or create the story for your medium/platform, integrate the visualizations into the data story, and review with peers and experts to get feedback. This step can be time-consuming as you iterate on the content to get to your final data story. Again, take the time to iterate and get it right. The more you iterate, the more your data story will come off as well-written and produced, thoughtful, and not something that looks like it's half-baked.
Content Publish
This is where you deploy the data story to your chosen medium/platform, test for quality, and integrate with your social marketing campaign (if needed). If you can, review and test your content in a non-production (or private) environment. Make sure the story flows, links work, and so on.
Content Analytics
If you're a journalist or content creator, then you are likely trying to create an audience. To understand what resonates with your audience, take advantage of the analytics available to you from your chosen platform(s). So, at this stage establish engagement goals for the data story (e.g., impressions, views, click-through, etc.), track consumption of data story over time, and pull data on engagement (e.g., device, demographics, etc.). Also, be sure to separate unique views/impressions from total views/impressions and try and understand where your main audience is. This will help you tailor follow-on data stories, themes, and so on.
Retrospective
This is another step that we see customers skip. But, we recommend even taking an hour for yourself or with your team to conduct a retrospective. In this step, you collect analytics and feedback, review with peers and experts and note where you can improve on the next data story. During this process, we ask ourselves questions like what went well, what didn't work, what was the explicit and text-based feedback, and can we optimize our process for similar projects. Another reason to do a retrospective is to thank the team. Data stories can explore very tough and difficult topics (e.g., political corruption, abortion, crime, etc.), so give the team the time to talk through it and thank them.
Now that you have a high-level understanding of what sits within each of the steps, let's talk through some of the skills you (or your team) might need across each of the above steps.
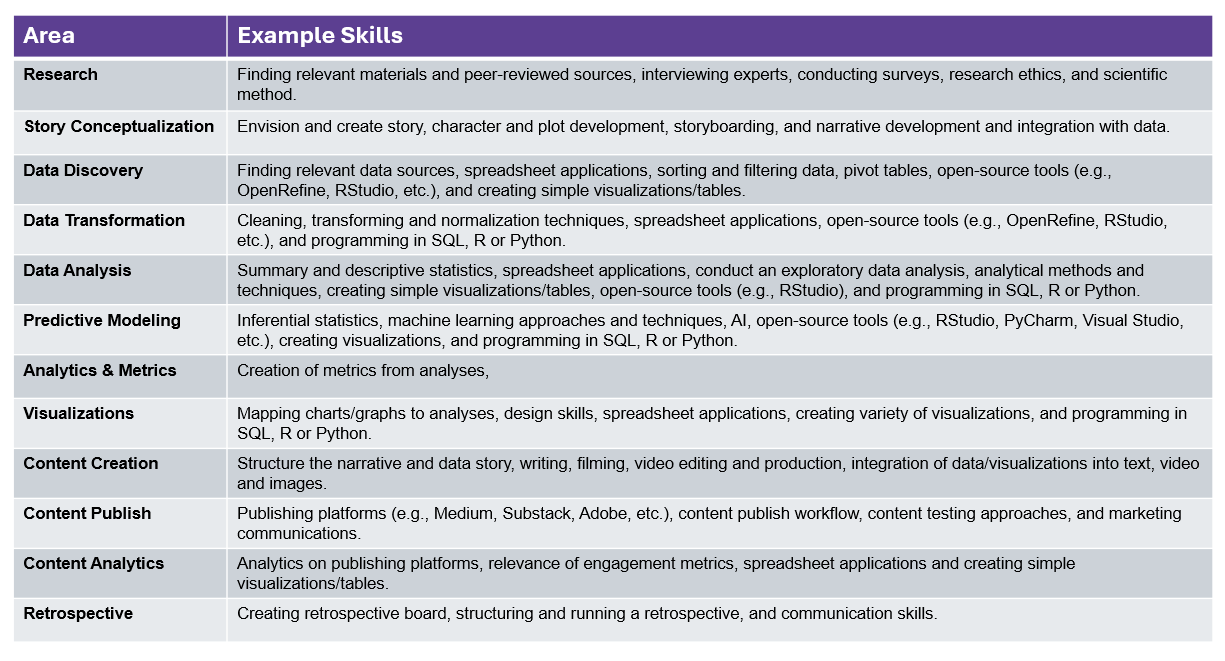
Data Storytelling Process Skills Matrix
Below is a matrix calling out example skills that you or your team would need for each of the steps.
Again, it's worth reinforcing here that if you're a solopreneur and wanting to go it alone, don't be overwhelmed by the skills listed out above. There are smart ways to scale and get projects done. Here are a sampling of different strategies to contemplate:
- Understand and write down your core strengths. Write down the skills needed for your project. Identify steps that you could do versus steps where you could outsource (e.g., to Fiverr).
- Scope your data story projects closer to your skills set and then for each new data story project, add a new element for you to learn. So, over the course of 5-10 projects, you grow your core skills.
- Create a small team of like-minded passionate people whose skills fit the needs of a data story project (or have different but complementary skills). Then, create a plan for the data story project assigning certain aspects of the project to those with the appropriate skills.
- Become an expert in a single type of data story and stick with it, for example, infographics – which are a specific type of data story that require a combination of analytical and design skills.
These are just a few sample strategies. You'll find your needs may shift depending on whether you're operating solo, if you have a team, if the project is part of a formal news/sports organization, and of course the size and scope of the project.
Summary
In this newsletter, we discussed our multi-step process for building and publishing data stories. The process scales up or down depending on the size, scope and complexity of the project, and you might find that some steps in the process are optional for you (e.g., a descriptive analysis may be fine for your data story so no need for predictive modeling).
We also listed out some example skills mapped to each of the steps. The list of skills for each step is not comprehensive, but will give you a sense for the different types of skills you may need to be picking up or using within each phase of the process.
Each step has a mix of skill associated with it – from the creative to the technical, so to help you grow your own skills, we will provide you with more resources to learn, such as:
- More detailed newsletters on each step
- Introductory courseware
- Tutorials with hands-on labs with leave-behind resources
- Datasets you can use for your own projects
- Deep dives on a selection of projects we've curated for you
And more.
Subscribe today!