
The Team Balance Index (TBI) is a composite metric that measures how a team performs across offense, defense, goaltending, and grit. This post provides an overview of TBI.
Introduction
Hockey fans are passionate and love to argue about who's the best. The argument typically comes down to things like who has the most firepower, the hottest goalie or the brick wall between the pipes. Instead of singling out one part of a team's game, TBI asks a different question: how complete is this team on balance?
In this post, we'll explore why TBI matters, how to interpret it and how you can use it to predict wins.
What is TBI?
TBI is a composite metric that measures the performance balance of a team. The composite part means we calculate a weighted average across categories of hockey stats, which results in a single, normalized TBI score. A higher TBI is typically better than a lower TBI score, though it's important to look at the four categories that comprise TBI.
Every team gets a TBI score that ranges from 0 to 100 in four categories:
- Offense (OFF): how well a team generates scoring chances and puts pucks on net.
- Defense (DEF): how well it limits what opponents get.
- Goaltending (GOAL): how well its goalies stop pucks at the net.
- Grit (GRIT): the physical, hard-to-play-against side of the game.
Average the four weighted scores and you get TBI. Take the Colorado Avalanche: 68.7 on Offense, 77.4 on Defense, 82.0 in Goal and 20.3 in Grit. Together that works out to a TBI of 62.1 (or 62.1%). It's not a perfect metric, but more of a summary metric that gives you indications of where a team is doing well or challenged.
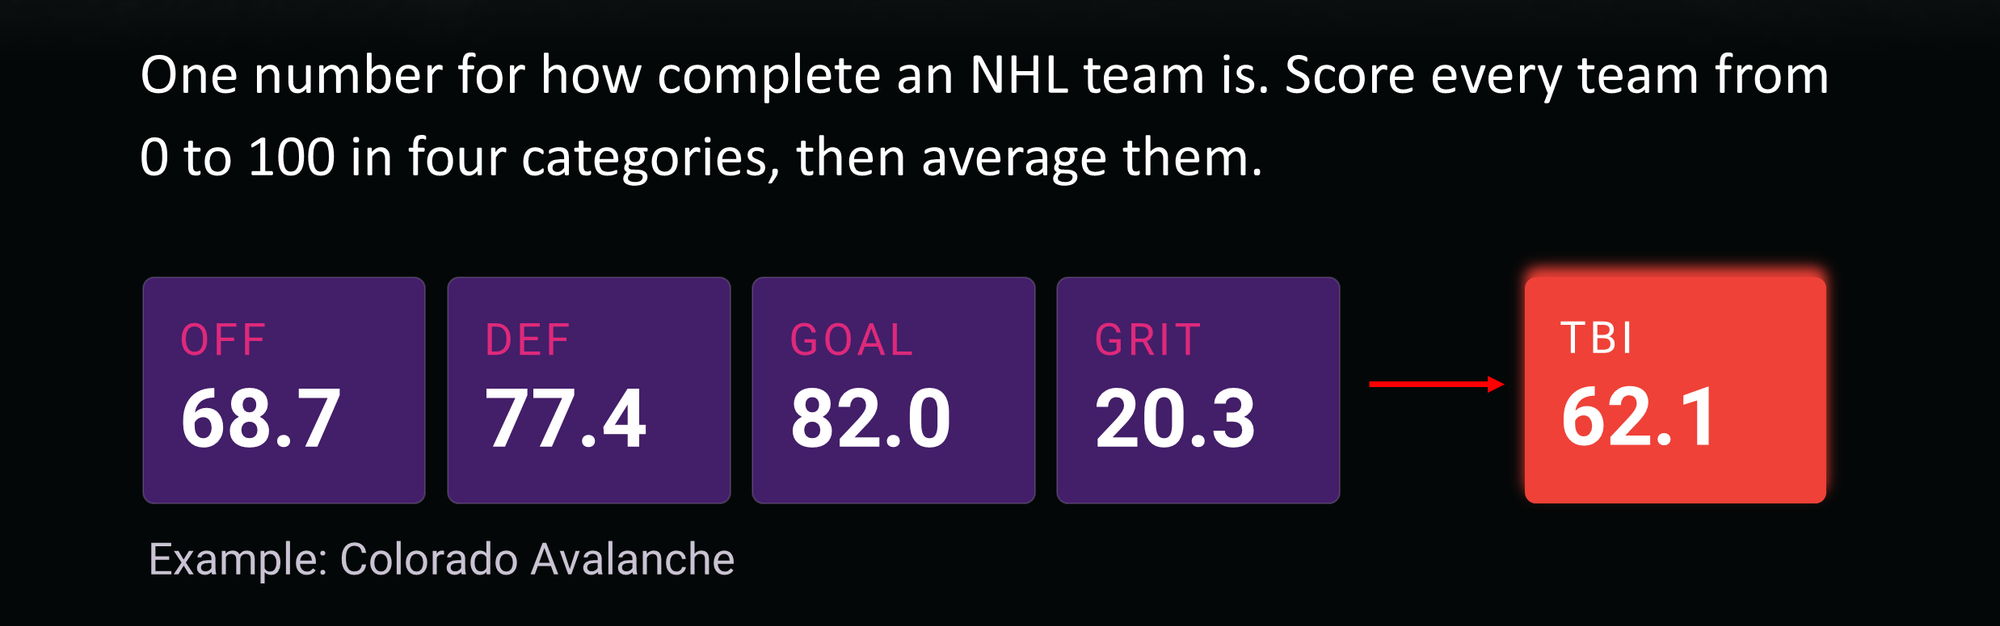
Because every category sits on the same 0–100 scale, you can compare teams directly, whether that's two clubs, two divisions or two conferences. Further, you can use the four categories as high-level indicators of where a team may be strong or weak – giving you a starting point for a secondary analysis.
Why It Matters?
One elite category can hide three weak ones. For example, a team with a dangerous power play and a star scorer will look great on the highlight reel, but a 60-minute game exposes every weakness. TBI makes you look at key categories across the team.
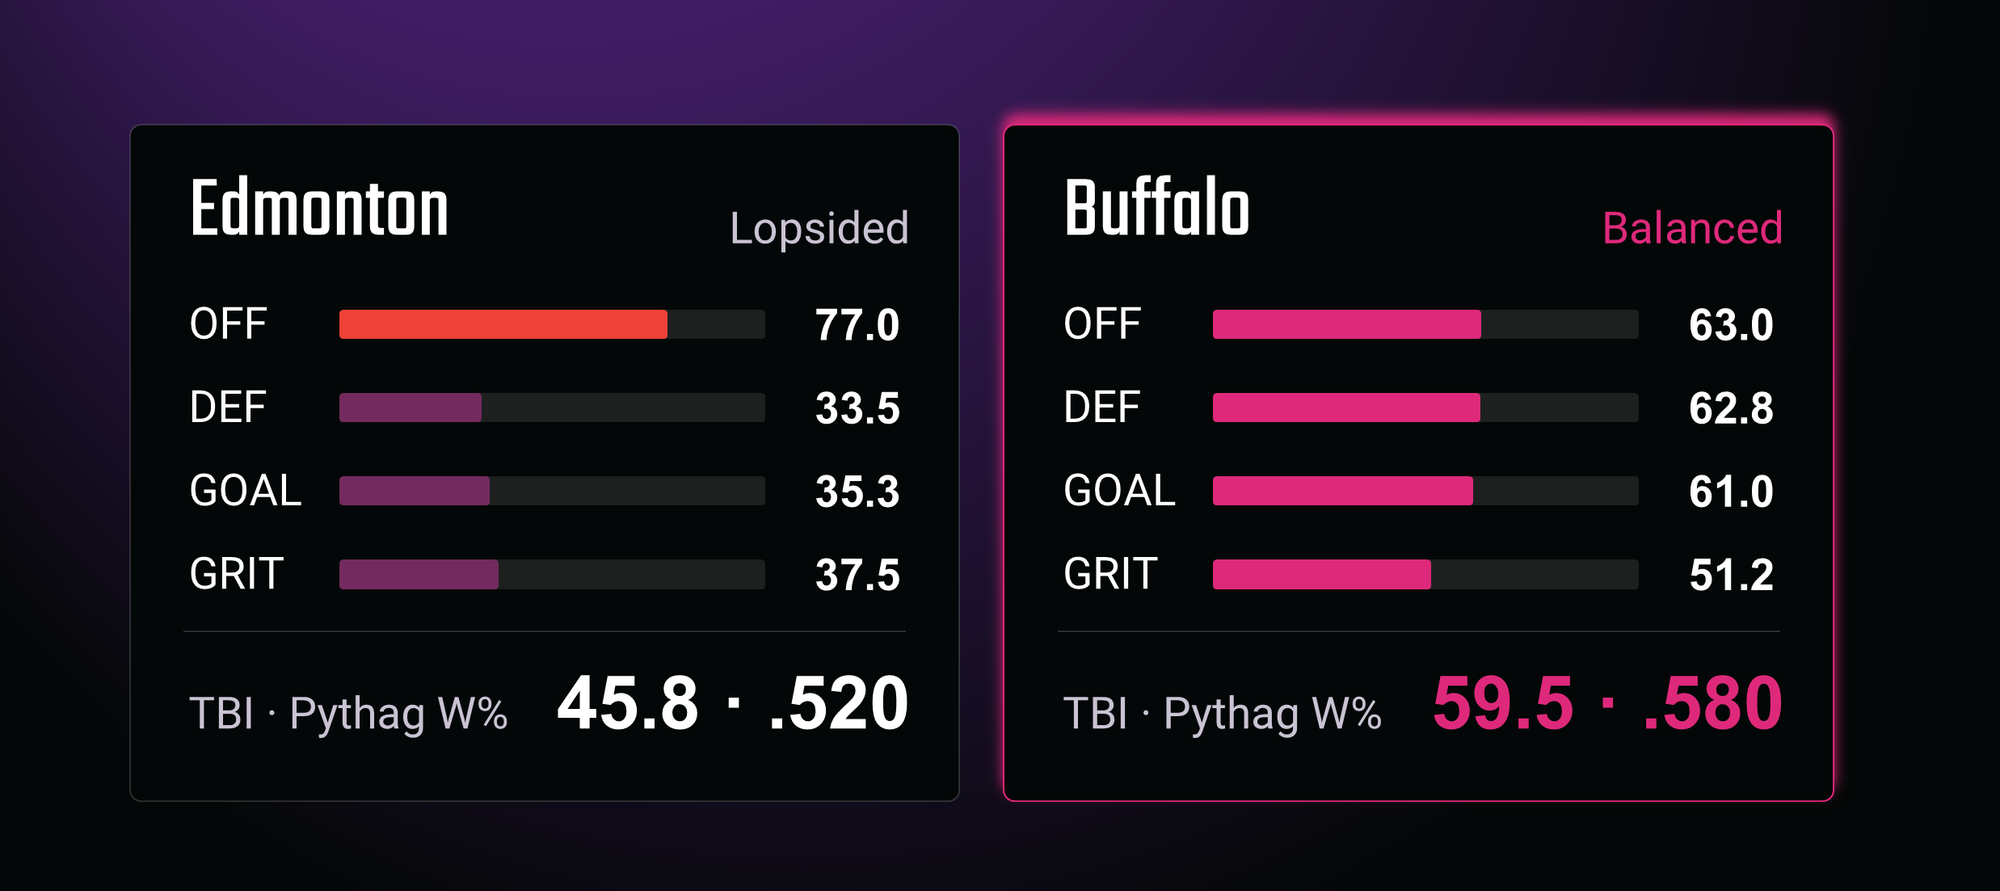
For example, compare Edmonton and Buffalo. Edmonton is arguably lopsided; they have an elite-level 77.0 on Offense, but 33.5 on Defense, 35.3 in Goal and 37.5 in Grit. That adds up to a TBI of just 45.8 and a Pythagorean Win Percentage of .520 (or 52%). Conversely, Buffalo is pretty equal in their TBI breakdown: 63.0 on Offense, 62.8 on Defense, 61.0 in Goal and 51.2 in Grit. With this level of consistency, the Sabres post a 59.5 TBI and a .580 Pythagorean win percentage, better than Edmonton on both counts.
The pattern isn't new. In the 2025 Stanley Cup Final, Florida scored high in both grit and goals and carried a significantly higher overall balance than Edmonton. We all know how that series ended.
How to Use It: Start with the Heatmap
The easiest way to read TBI is as a heatmap. Each row is a team and each column a category, colored from weak (dark purple) to elite (red).
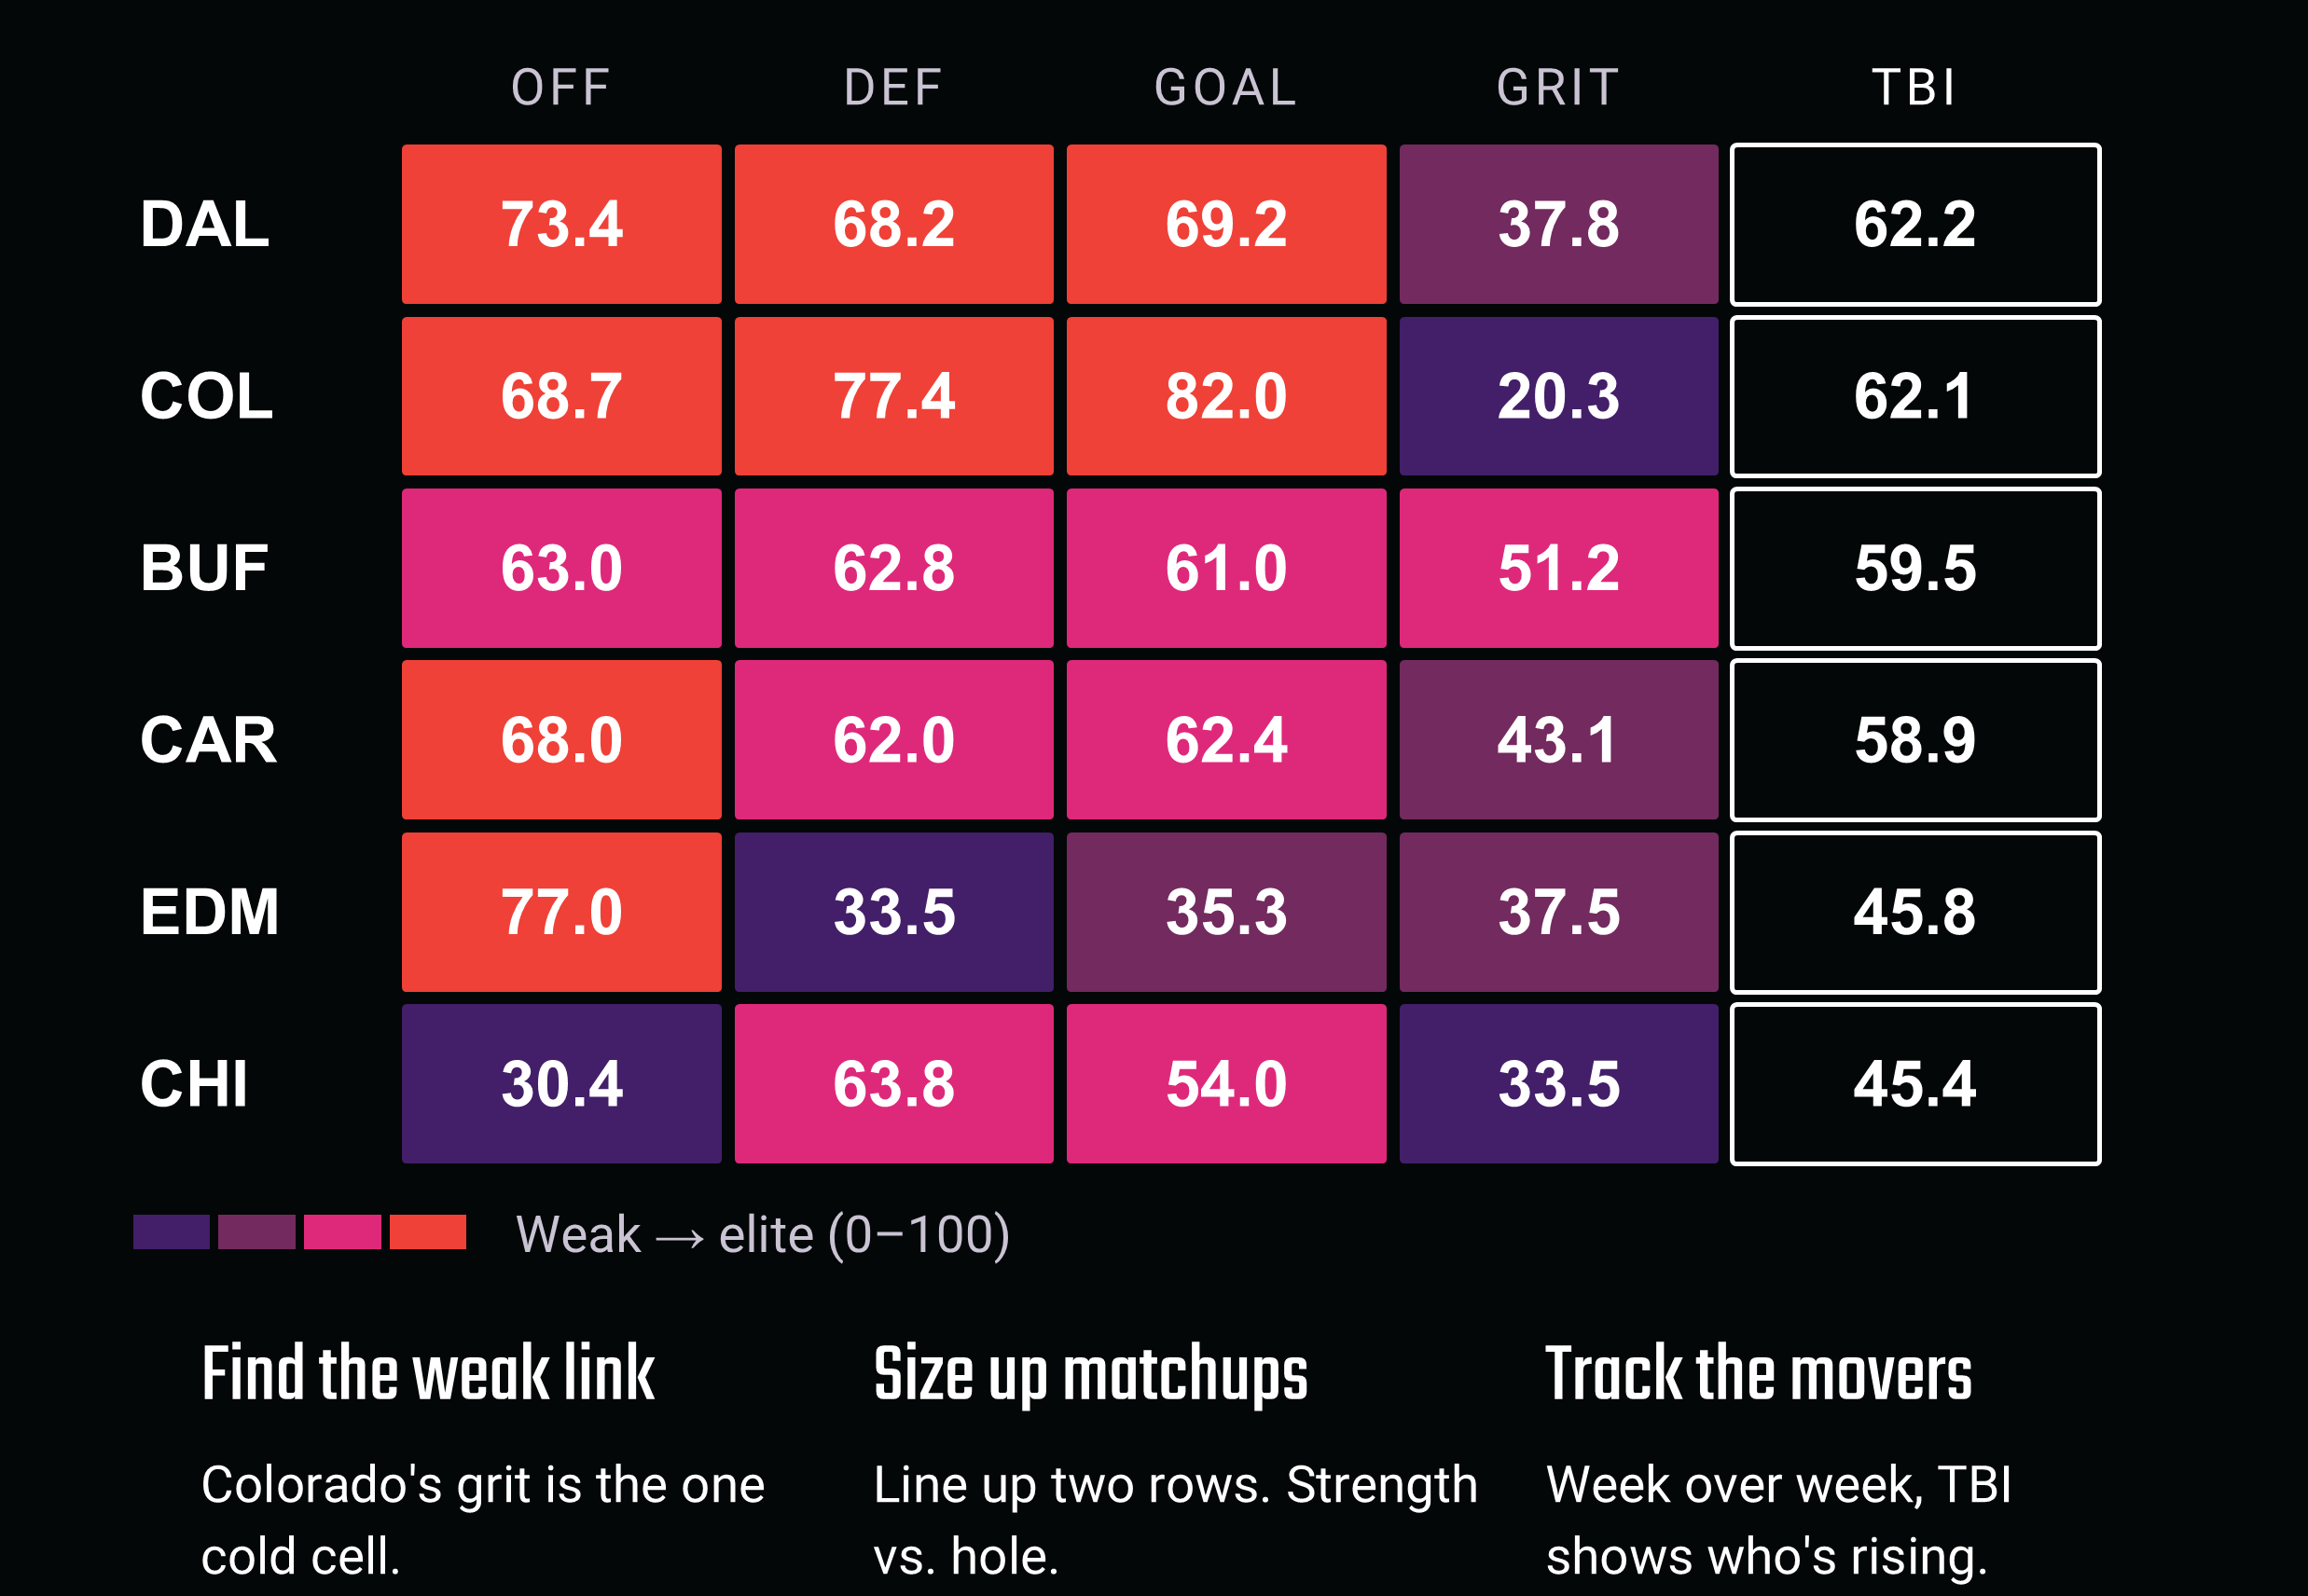
When starting out with the TBI score, there are three ways to use it:
- Find the weak link. Scan a row for the one cold cell. Colorado is red across Offense, Defense and Goaltending, but its 20.3 in Grit stands out as a weakness.
- Size up matchups. Line up two rows and look for where one team's strength meets the other's hole. Chicago (30.4 on Offense) facing Colorado's 77.4 Defense is a mismatch you can see at a glance. Dallas (62.2) and Colorado (62.1) are nearly tied on TBI, but they get there differently: Dallas is steadier across the board, while Colorado leans on elite defense and goaltending
- Track the movers. Week over week, changes in TBI show who's rising and who's slipping, often before the standings catch up.
The heatmap also works at a higher level. When we first tested TBI on the 2024–25 season, the Metropolitan Division had the lowest average balance in the league, and teams with high overall TBI could still show clear holes in individual categories. In short, you can summarize divisions in the league to see, at a high level, how the teams in those divisions compare.
Can it Predict Wins?
It's early in the testing of this metric, but we believe it can – with the typical caveats for predictive modeling in sports. For example, our early experiments on the 2024–25 season showed TBI moving in the same direction as Win/Loss Ratio and the Pythagorean Win Percentage (a win rate estimated using Goals For and Goals Against), but those first results were preliminary.
The current TBI numbers (from 10/08-10/14) are much clearer. That is, if you plot every team's TBI against its Pythagorean Win Percentage you get a correlation of r = 0.889 (or ~89%). The New York Rangers (66.5) and Carolina Hurricanes (62.9) sit at the top of both measures, while the Chicago Blackhawks (31.9) sit at the bottom.
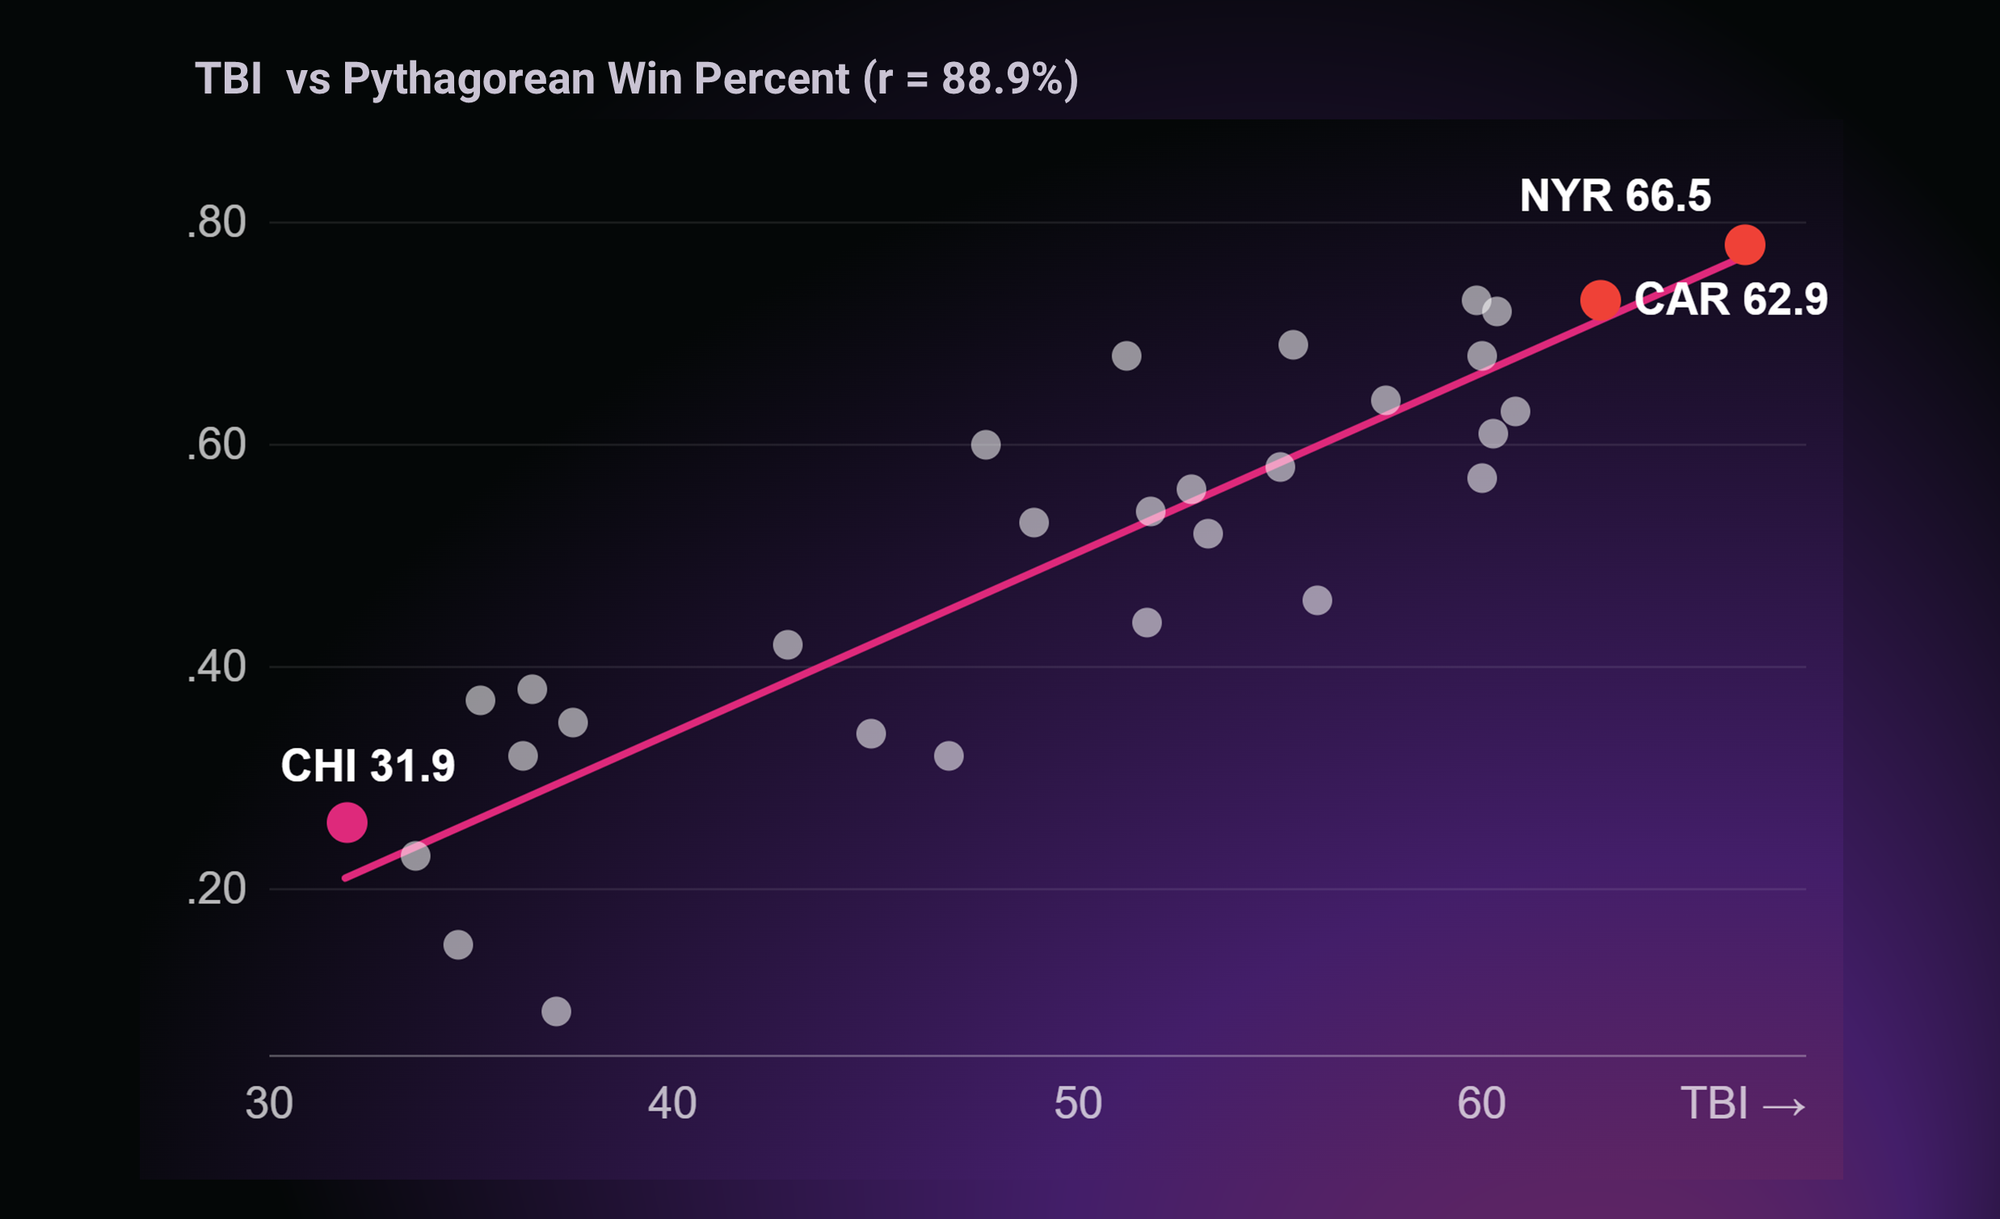
You can compare the above chart with the league standings as of 10/14 (the window for this analysis). You'll see that the teams at the top-right of the above scatter chart were higher in the standings.
TBI isn't perfect, but it has potential, and we continue to see it especially useful for top-level comparison, diagnosis and potential win predictions. Our goal is to test it each week this season to see how we can use it – even as a directional metric and to spot early where the challenges may lie for specific teams.
The bottom line: TBI is a decent signal, not a crystal ball. Use it to spot which teams are built to keep winning.

