
Within the Numbers # 24
Using the Team Balance Index (TBI) to evaluate which NHL teams are moving towards or away from winning.
Introduction
Every week, Data Punk Media scores all 32 NHL teams with the Team Balance Index (TBI), our composite team rating that summarizes on balance how a team is performing. The idea behind it is simple: teams with a higher TBI (or balance) tend to win more games.
It's tough to find productive signal in the first week of a regular season – teams are still shaking the cobwebs. However, we evaluated the games during the week of 10/08-10/14, and we began to see some interesting signals, which we'll cover here today. In short, we saw that a handful of clubs made big moves in both directions.
Does Higher TBI Mean More Wins?
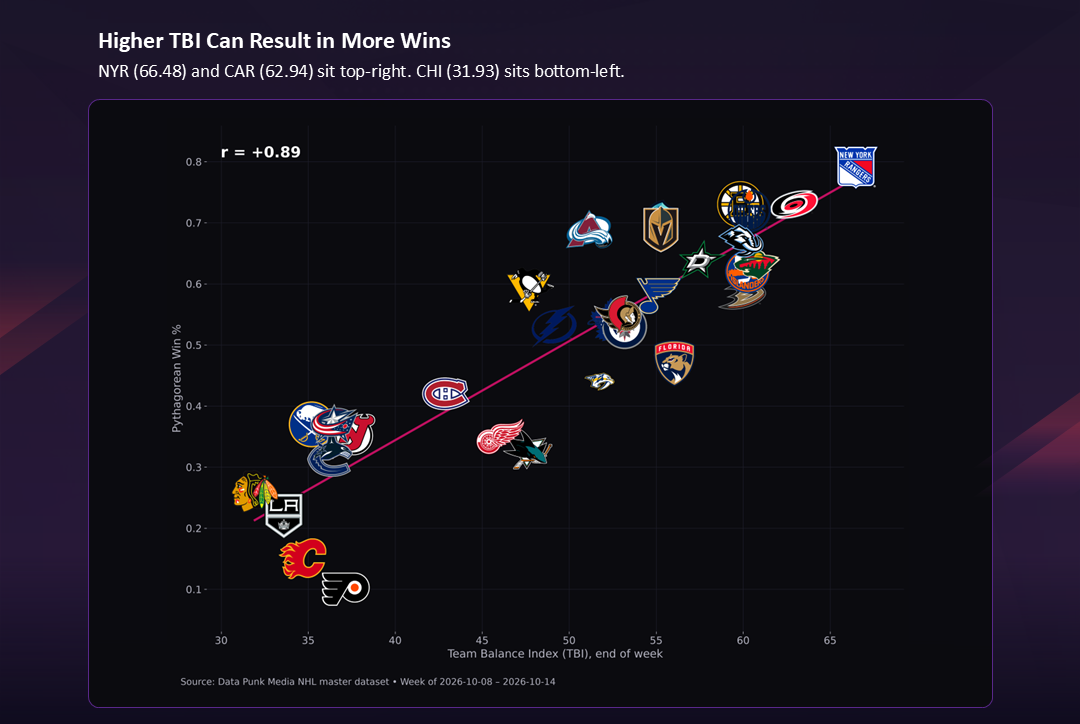
The way TBI moves with Win Percentage, we would argue there's a positive relationship between a higher TBI and more wins. Of course, there are always exceptions, but on the whole the relationship is statistically strong and positive (both are moving in the same direction).
For example, plot every team's TBI against its win percentage and the pattern is hard to miss: the two measures carry an 89% correlation (for this week's run). We're not claiming causality, but it is a strong correlation. The New York Rangers (66.48) and Carolina Hurricanes (62.94) sit in the top-right corner of the chart, with high scores and plenty of wins to match. The Chicago Blackhawks (31.93) anchor the bottom left. Ugh, sorry Chitown.
The Ceiling and the Floor
The distance between the league's best and worst is wide. A full 34.6 points separate the top team from the bottom one. For example, up top, the Rangers (66.5), Hurricanes (62.9) and Minnesota Wild (60.8) lead the way, with the Edmonton Oilers (60.35) and New York Islanders (60.25) right behind them. At the floor sit the Blackhawks (31.9), Los Angeles Kings (33.6), Calgary Flames (34.7), Buffalo Sabres (35.2) and Vancouver Canucks (36.25).
This Week's Biggest Movers
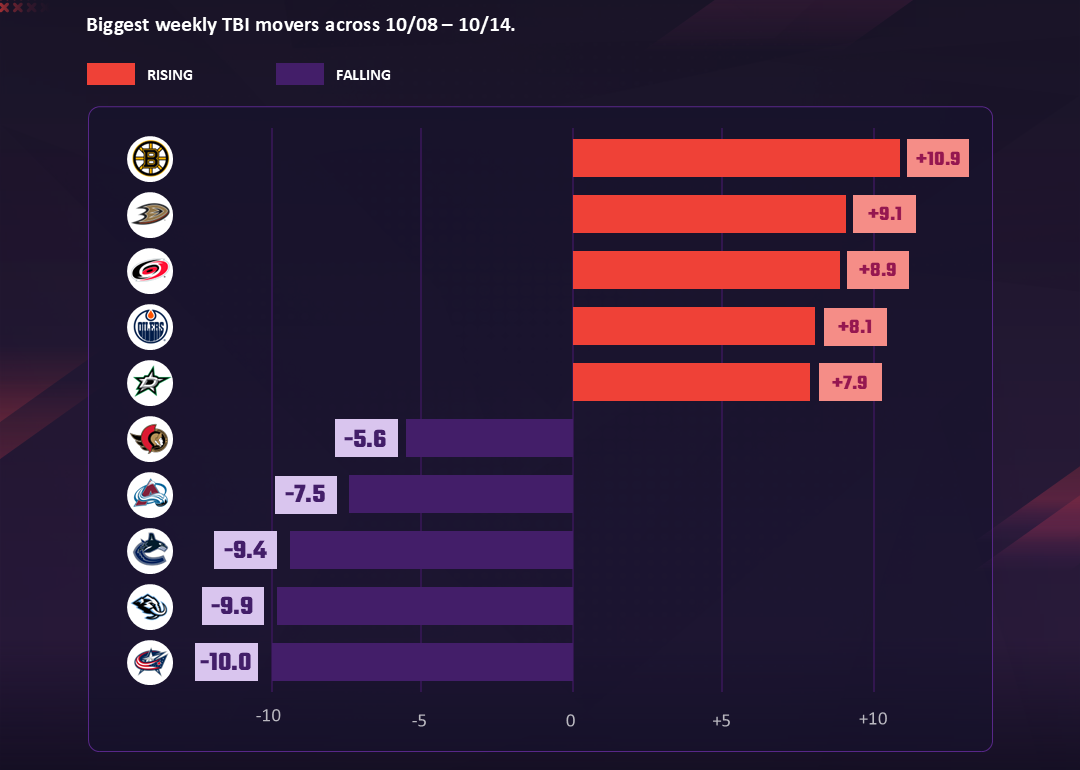
Five teams gained at least 7.9 points in a single week: Boston (+10.9), Anaheim (+9.1), Carolina (+8.9), Edmonton (+8.1) and Dallas (+7.9). On the other side, Columbus (−10.0), Seattle (−9.9), Vancouver (−9.4), Colorado (−7.5) and Ottawa (−5.6) all slid.
The Box Scores Agree
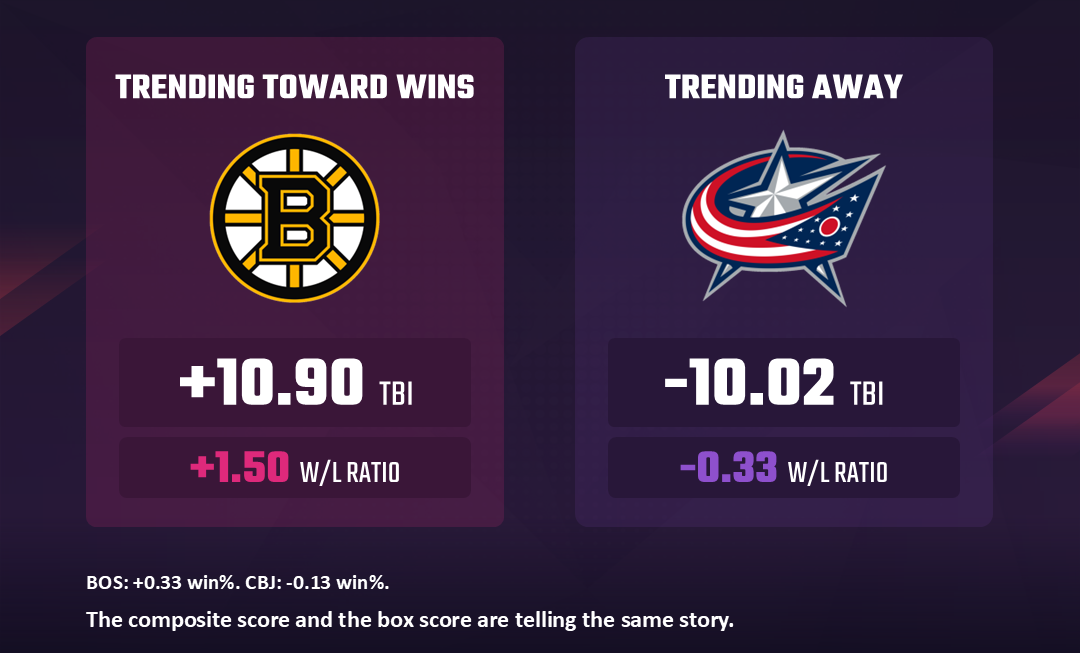
A composite score is only useful if it tracks what happens on the ice, which we can measure through metrics like Win/Loss Ratio (W/L Ratio). For the biggest mover on each side, it did. Boston's +10.90 TBI jump came with a +1.50 swing in its W/L Ratio and a 0.33 gain in win percentage. Columbus's −10.02 drop came with a −0.33 W/L Ratio change and a 0.13 dip in Win Percentage. In short, the composite score and the box score are singing off the same sheet.
The Riser: Boston Bruins
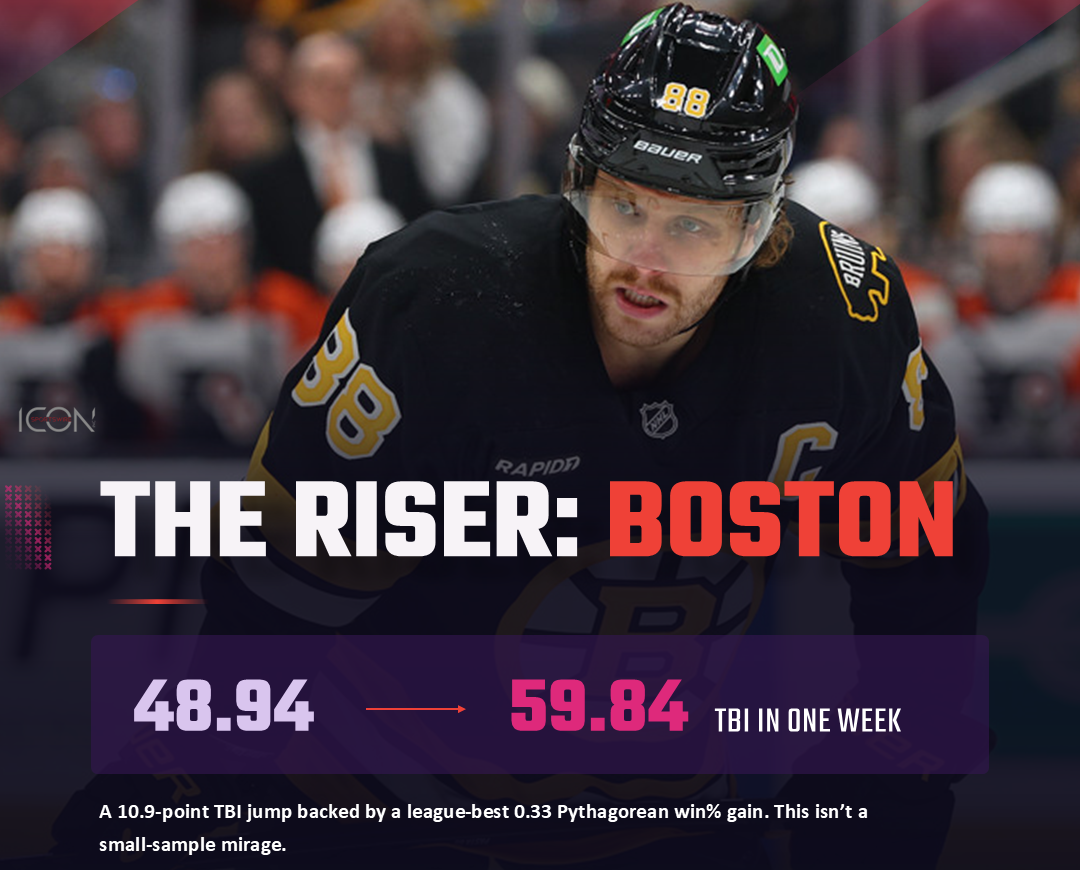
No team climbed further than the Bruins, who went from 48.94 to 59.84 in one week. What makes the jump convincing is what's underneath it: Boston also posted the league's best gain in Pythagorean Win Percentage (+0.33), a measure built from goals scored and allowed rather than the final result alone. That points to a team playing better, not just getting lucky. This doesn't look like a small-sample mirage.
Who to Watch Out for Next Week?
The most interesting teams this week are the ones where TBI and results disagree. For example, Ottawa lost 5.56 points of TBI, yet leads the league with +1.15 Wins Above Expected. The Senators are winning more than their underlying numbers say they should. Conversely, the Stars gained 7.91 points of TBI but sit last in the league at −1.48 Wins Above Expected. Their play is improving, and the results haven't caught up yet.

If the 89% correlation holds, those gaps should start to close: Dallas's results could turn, and Ottawa may come back to earth.
Who will be on the rise next week?
