
Within the Numbers Series # 6
The Next Step for the Drive Score Metric
Through the first four races of the 2026 Formula 1 season, we took our Drive Score and developed it into a weighted metric, testing and iterating on different versions to better understand what truly drives race outcomes. Each iteration brought new insights, which we shared throughout a module in our living course. While that module has now wrapped up, the process behind building a reliable metric is still very much ongoing.
Instead of structured lessons, we’re continuing that same approach through our Within the Numbers series. After each race, we’ll release a newsletter showcasing how we used our weighted Drive Score metric to predict the grid, evaluate what actually happened, and refine the model based on what the data reveals.
Miami was the first step in that next phase, starting with the weighting we carried forward, the predictions it produced, and how those all played out.
Check out our Instagram site for regular updates and posts on our F1 coverage.
Revisiting Drive Score Version 2.0 in Miami
For the Miami Grand Prix, we stuck with Drive Score Version 2.0 (40/40/20), the model we established in our living course that had performed the most consistently through the first three races of the season.
For this version of the metric, the weighting consisted of:
- 40% preseason testing results
- 40% 2026 race performance (Australia, China, and Japan)
- 20% average Drive Scores from the 2024 & 2025 Miami Grand Prixs
This weighting continues to balance early expectations with what we’ve seen on track so far, while still accounting for track-specific history.
With three races now in the sample, recent performance is starting to carry more weight, but not enough to fully override preseason signals, especially coming off a long break where underlying performance may have shifted.
To make the model easier to interpret, the chart below assigns every driver on the grid a composite Drive Score based on our weighted metric. The higher the score, the stronger the model rates that driver heading into the race. Drivers are also colour coded by their team's to highlight how each constructor compares across the grid.
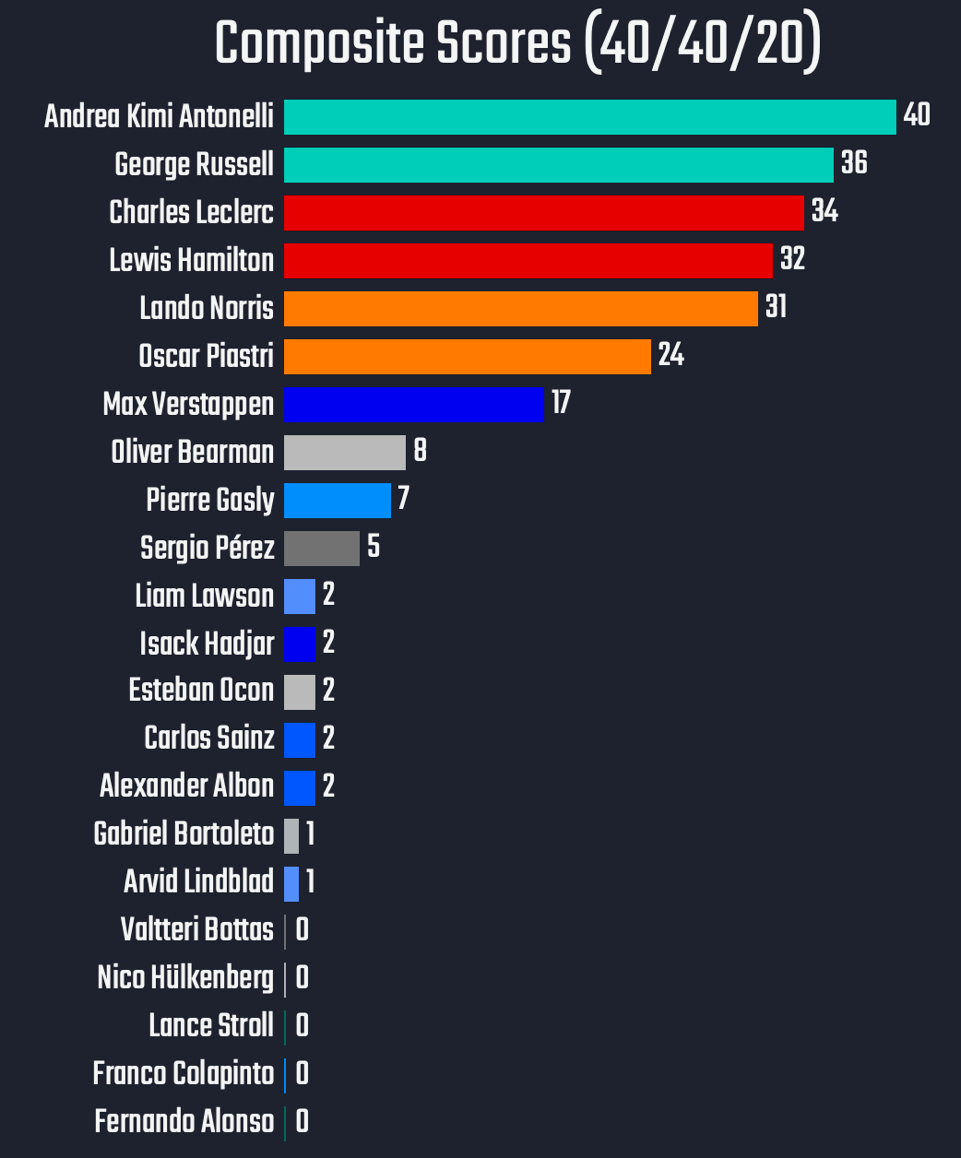
At a high level, the model continues to favor Mercedes at the front, with Antonelli and Russell leading the projections. Ferrari also remains firmly in the mix, placing both Leclerc and Hamilton within the top group. McLaren and Red Bull sit just behind that leading tier, with both teams still rated highly despite more inconsistent results to the start of the season, which is a reflection of their strong preseason performance and past Drive Scores in Miami. Behind them, the rest of the field is more tightly clustered, with smaller gaps separating drivers and leaving room for potential movement depending on race conditions.
The extended break between races also adds another layer of uncertainty, potentially opening the door for shifts in performance that the model may not fully capture. Overall, the projections point to a relatively stable structure at the top of the grid, but with enough compression, and uncertainty, that even small changes could significantly impact the final order.
Want to see more sports stories? Explore the projects and sports stories published on Stories.
What Actually Happened in Miami?
When the lights went out in Miami, here's how the race actually unfolded for the top 8 drivers, and how far back they were from the race winner:
- Kimi Antonelli – Mercedes (1:33:19.273)
- Lando Norris – McLaren (+3.264s)
- Oscar Piastri – McLaren (+27.092s)
- George Russell – Mercedes (+43.051s)
- Max Verstappen – Red Bull (+48.949s)
- Lewis Hamilton - Ferrari (+53.753s)
- Franco Colapinto - Alpine (+61.871s)
- Charles Leclerc - Ferrari (+64.245s)

Key Takeaways
At a high level, the same four teams continue to define the front of the grid — Mercedes, McLaren, Ferrari, and Red Bull — but the gap between them is beginning to tighten.
Coming into Miami, the model still leaned toward Mercedes and Ferrari as the most stable front-runners, with McLaren and Red Bull just behind. This race largely reinforced that grouping, but also showed how quickly the order within it can shift. McLaren, in particular, looks to have taken a clear step forward over the break. After locking out the top two positions in the sprint, they carried that pace into the race with a double podium finish, signaling that they’ve firmly entered the fight at the front.
Mercedes still found a way to come out on top, with Antonelli converting pole into a win and taking his third consecutive Grand Prix victory, continuing a strong run of form. On the other side of the garage, George Russell finished fourth for the second Grand Prix in a row, suggesting a slight dip relative to his teammate. With Antonelli consistently delivering at the front, a potential intra-team battle at Mercedes may be starting to take shape.
Overall, Miami reinforced the strength of the leading group, but also exposed how compressed it has become. What once looked like a clear Mercedes advantage is starting to narrow, and with multiple teams now capable of challenging at the front, the order is becoming increasingly unpredictable.
Want to join an upcoming Sports, AI and Storytelling workshop? Check out our Offerings page and our publicly-available workshop schedule.
Introducing Drive Score 4.0
So how should the model adjust to reflect that shift? For the Canadian Grand Prix, we’re moving to Drive Score Version 4.0, a model that shifts fully away from preseason expectations and leans entirely into our previous seasons Drive Scores, as well as race performance from the 2026 season.

After four races, we now feel there is enough real race data that we can use for predicting race winners; that is, the preseason data no longer provides the same level of predictive value it did early in the year. While preseason results helped establish an initial baseline, recent on-track performance now offers a much clearer picture of each team’s true pace and current form.
For Canada, the model will consist of:
- 80% weighted 2026 race performance
- 20% average Drive Scores from the 2024 & 2025 Canadian Grand Prix’s
However, within that 80% season component, races are no longer weighted equally.
Instead, the model now uses a tapered weighting structure that prioritizes recency, giving more influence to the races that likely best reflect the current state of the grid. Miami carries the highest weight, followed by Japan, then China, with Australia carrying the smallest share as the opening race of the season. The final weightings are shown below:
- Miami Race Results (32%)
- Japan Race Results (24%)
- China Race Results (16%)
- Australia Race Results (8%)
This approach reflects how quickly performance can evolve across a Formula 1 season. Teams continue to develop their cars, drivers gain confidence within new setups, and the competitive order can shift significantly from one month to the next. By placing greater emphasis on recent races while still maintaining some historical track context, Drive Score Version 4.0 aims to better capture the current balance of form heading into Canada.
The chart below shows the final projections produced by Drive Score Version 4.0 for the Canadian Grand Prix. Again, with each bar and number representing a driver’s total weighted score, with colours corresponding to their team.
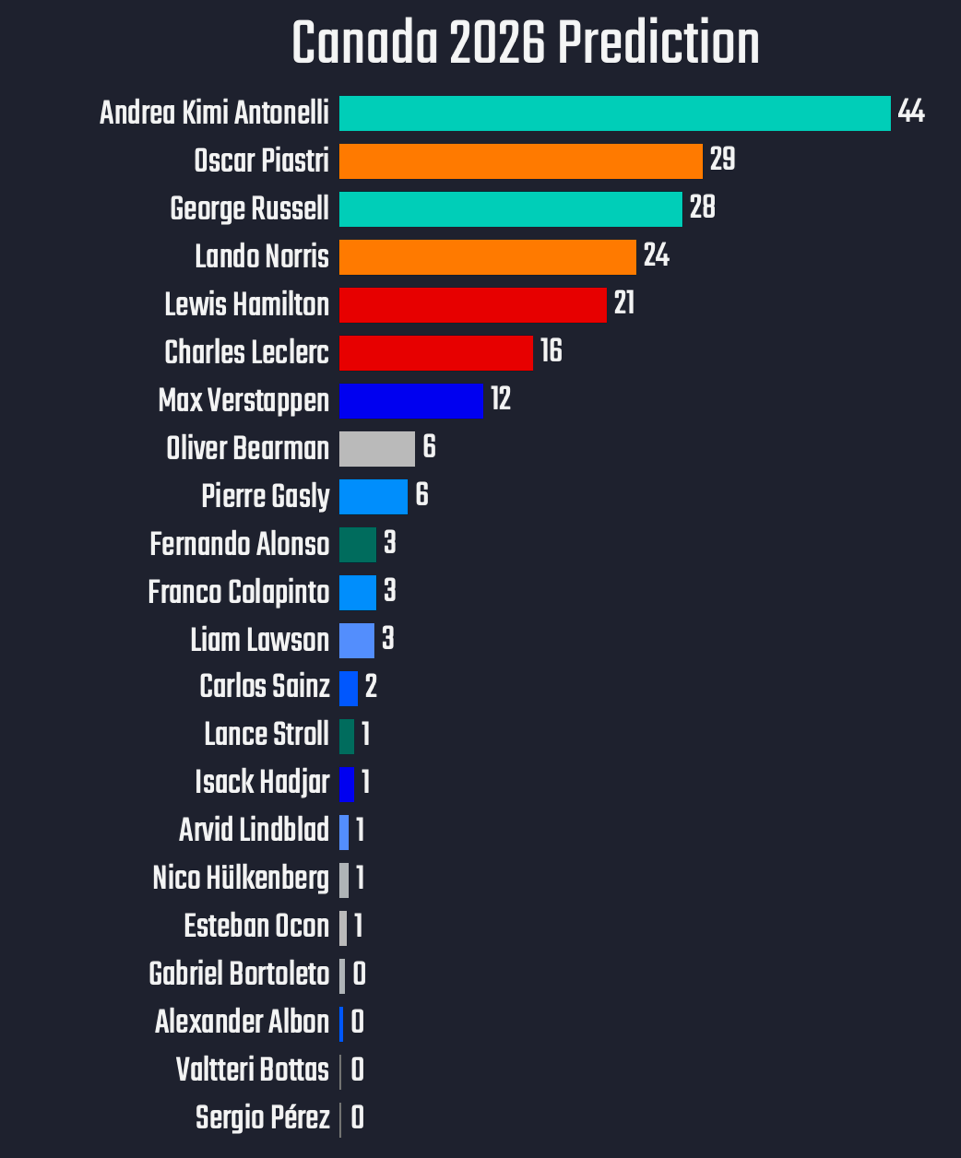
At a high level, the projections still suggest that Mercedes enters Canada as the team to beat, but the gap at the front continues to tighten.
Antonelli remains comfortably on top of the model following his dominant stretch of results, but the separation behind him is much smaller than in previous races. McLaren, in particular, appears to be the biggest mover in Drive Score Version 4.0, with both Piastri and Norris climbing firmly into the top four after their strong showing in Miami.
George Russell still projects near the front, but for the first time this season, he no longer sits as clearly ahead of the McLaren drivers. That reflects both McLaren’s recent improvement and the increased emphasis the model now places on recency.
Ferrari presents an interesting contrast. Hamilton remains projected inside the leading group, while Leclerc drops slightly lower than expected relative to previous races. Meanwhile, Verstappen and Red Bull continue to sit just outside the top tier, suggesting the model still sees them as competitive, but lacking the consistency shown by Mercedes and McLaren over the last several races.
Overall, the predictions paint a picture of a much more compressed grid at the front than what we saw early in the season. Rather than one team clearly controlling the field, Drive Score Version 4.0 suggests Canada could feature multiple realistic contenders depending on how qualifying, strategy, and race pace ultimately unfold.
Do you want to learn more about how to create data-driven sports stories? Then check out our newly published e-book: Sports, AI and Storytelling - A Primer.
Looking Ahead to Canada
With Miami now in the books, the focus shifts to the Canadian Grand Prix, and to the first real test of Drive Score Version 4.0.
Through the opening stretch of the season, the model has gradually evolved from a preseason-based projection system into one that increasingly prioritizes current form and recent race performance. Canada marks the clearest version of that shift yet, with recency now carrying more influence than at any previous point this season. At the same time, the competitive picture across Formula 1 is becoming far less predictable.
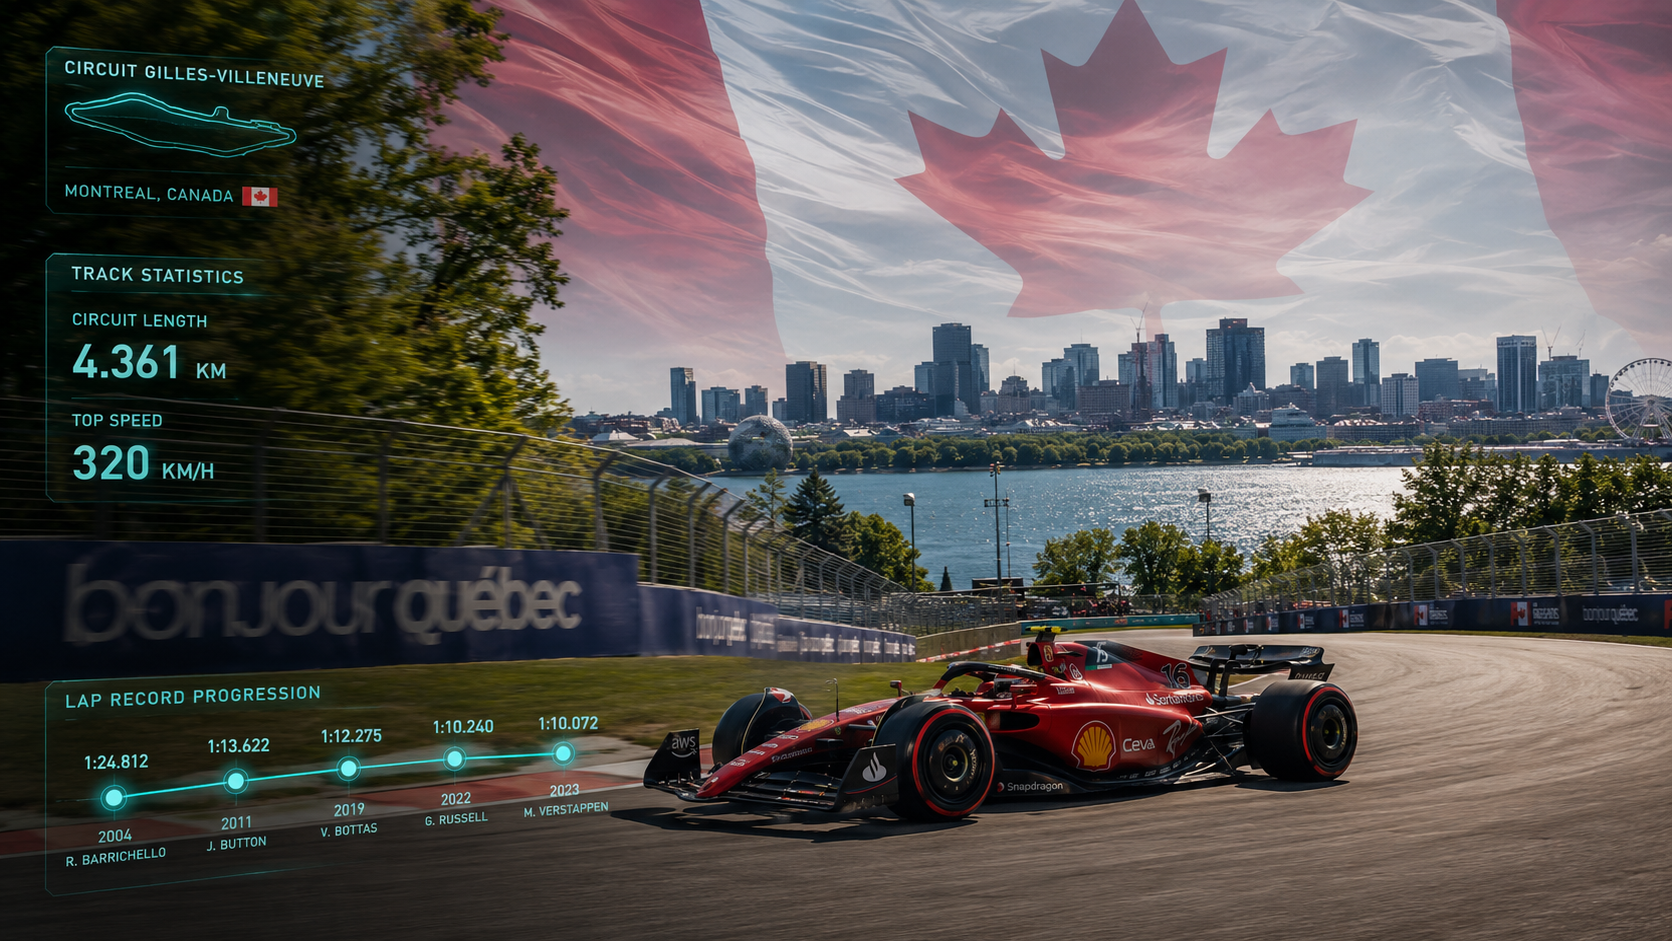
Mercedes still appears to hold a slight edge, but McLaren’s rise, Ferrari’s relatively continued consistency, and Red Bull’s ability to remain within striking distance have created a much tighter battle at the front than what we saw in the opening races. That makes Canada an important checkpoint, not just for the teams, but for the model itself.
The next edition of Within the Numbers will return following the Canadian Grand Prix, where we’ll evaluate how Drive Score Version 4.0 performed, what it got right, where it struggled, and what that means for the next evolution of the metric moving forward.