
Within the Numbers Series # 5
Evaluating Playoff Teams Without a Predictive Model
We build a lot of predictive models, but good, useful models can take time to build. You take inputs, assign weights, simulate outcomes, and arrive at a probability. It’s clean, structured, and often effective over a long season. Further, you can build a baseline predictive model for the regular season, but often times predictive models get a bit more wobbly in the playoffs – the game changes with the stakes. That is, the playoffs don’t behave like the regular season. They compress time, amplify variance, and expose dynamics that models struggle to fully capture, particularly what happens when a team’s primary strength is neutralized.
So, what if you don't have the time to build one but you still want to get some signal on who might win?
Instead of building a formal predictive model, you can look for signals. These signals aren’t probabilities, but patterns that reveal how teams play. For example, they illustrate how offense is generated, if a team plays both ends of the ice, how defense holds under pressure, whether production is concentrated or distributed, and whether a team’s strengths are more production oriented or physical. You can then create profiles that you can use for deeper analysis or for your story.
For this week, we'll assume you're short on time, and you want to create a profile for each of the four teams in the PWHL playoffs. This will be the beginning of your story.
Interested in taking one of our live workshops on Sports, AI and Storytelling? Then check out our Offerings page.
Short on time? Check out the quick-hit video below.
The Signals That Define the Four Playoff Teams
Out of the eight teams in the PWHL, four teams have made it to the playoffs:
Let's explore each of the teams.
Boston Fleet
Boston emerges as a team defined by structure and physicality. Their core metrics profile is balanced, but what pushes them to the top is their edge in Hits per Game. For example, per the heatmap below, it is evident that Boston are both higher overall on the average of the core metrics shown here and they're higher largely due to their physical game.
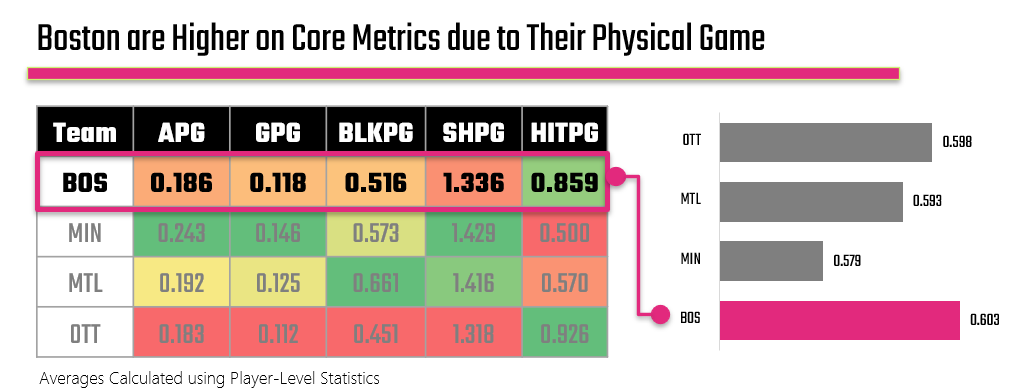
This edge elevates their overall performance profile. When you pair that with elite goaltending, anchored by Aerin Frankel’s .953 save percentage (the second-best goaltender in the league), you begin to see the identity clearly.
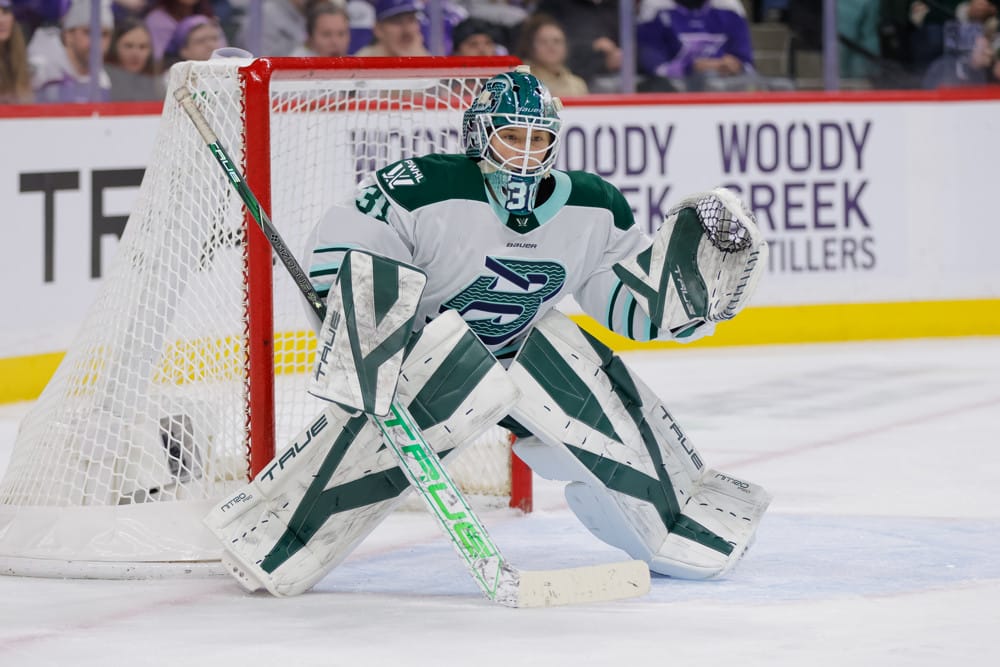
And while Boston are still pretty strong on their production stats (e.g., Assists per Game and Goals per Game), they don’t try to outscore opponents; they aim to control the pace, disrupt rhythm, and rely on defense and goaltending to close games.
In a playoff environment, that approach is not just viable; it’s often decisive. The big question, though, is will this be enough?
Minnesota Frost
Minnesota, by contrast, represents the most dynamic offensive team in the field. They lead in both Assists per Game and Goals per Game, signaling a system that generates and converts chances at a high level. Unlike Boston, they have a less physical presence on the ice – which brings their overall core metric average down.
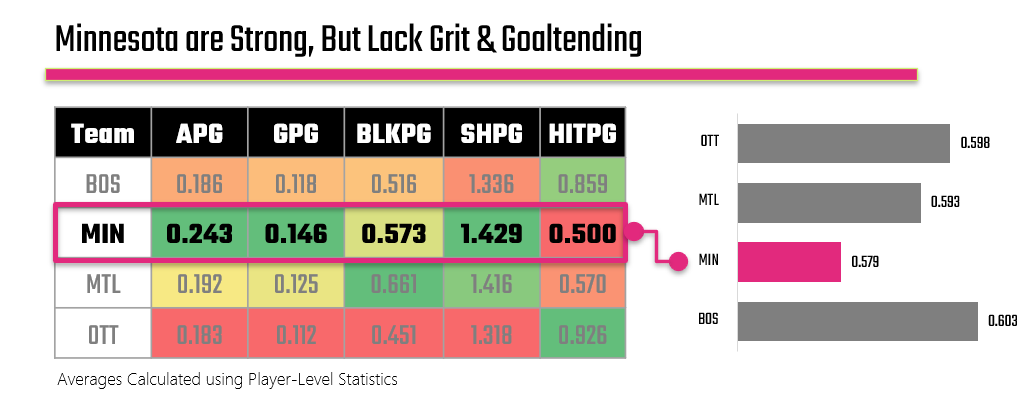
But the defining feature of Minnesota isn’t just production; it’s distribution. For example, the bar chart of top point producers reveals that five Minnesota players rank among the league’s top ten scorers – as shown below.
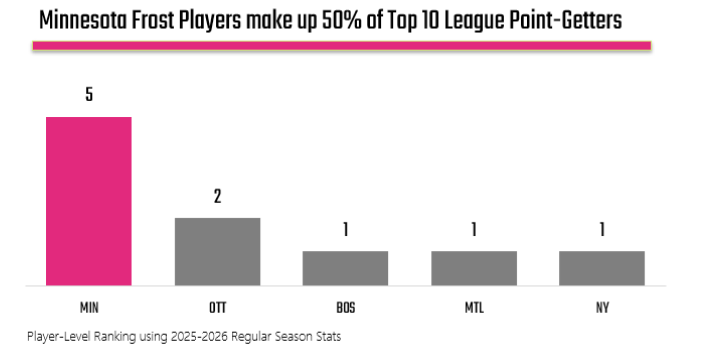
That level of depth creates sustained pressure, forcing opponents to defend multiple lines rather than focusing on a single threat. Their shot efficiency further reinforces this advantage, sitting well above the rest of the playoff teams.
However, the data also introduces tension. Their finishing metrics lag slightly behind their chance creation, and their goaltending sits in the middle tier of the group.
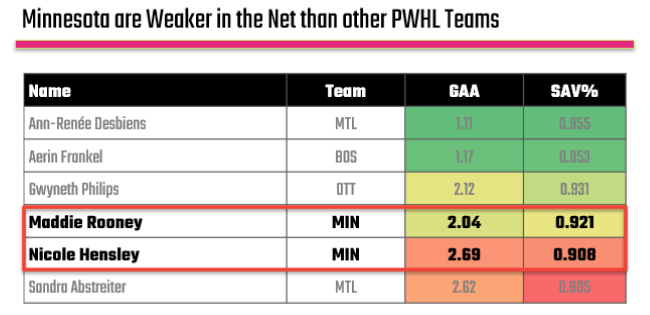
So, while Minnesota is strong on the offense, goaltending and physicality fall behind the other teams. For playoff hockey, this poses a problem because goaltending and physical play are strong determinants of success.
Montreal Victoire
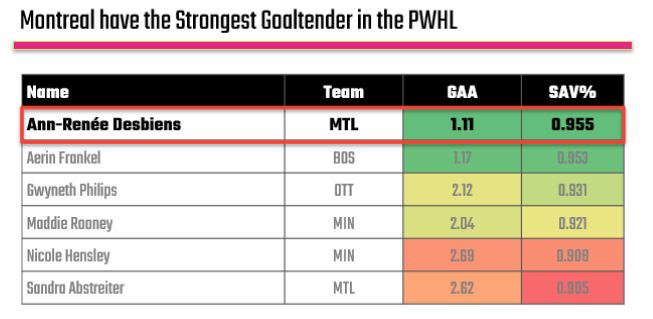
Montreal presents the most complete and balanced profile of the four teams. Their defensive structure is evident in their league-leading blocked shots per game, a signal of disciplined positioning and team-wide commitment to defense. This is complemented by elite goaltending, with Ann-Renée Desbiens posting a .955 save percentage, the highest among playoff goalies. The goalie performance heatmap makes this advantage immediately visible.
But Montreal’s strength isn’t limited to defense. Their special metrics indicate a team capable of finishing opportunities while maintaining strong two-way play.
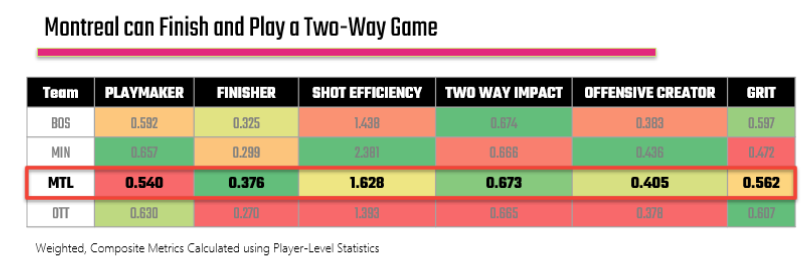
They don’t rely on high-scoring games to win; instead, they control the flow of play, limit opponent chances, and capitalize efficiently on the opportunities they create. Montreal doesn’t chase games; they dictate them.
Ottawa Charge
Ottawa is the most complex and potentially misleading team in the data. Their traditional production metrics are the weakest among the playoff teams, which might suggest a lower ceiling.
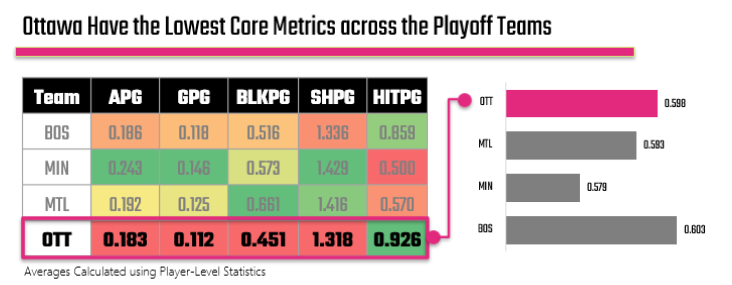
However, their custom metrics tell a different story. Ottawa scores well in playmaking and grit, indicating a team that generates pressure and plays with physical intensity.
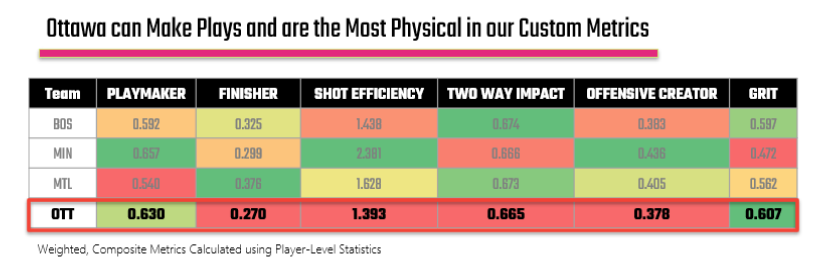
They lead in Hits per Game, reinforcing their aggressive style. This combination suggests a team that can disrupt opponents and create scoring opportunities. The challenge, however, lies in conversion. Ottawa’s Finisher Index is the lowest in the group, highlighting a gap between chance creation and goal production. They push the game forward, but they don’t consistently capitalize. That makes them dangerous in short bursts, but difficult to trust over a full playoff series.
Check out our Instagram site for more PWHL coverage in the weekly series entitled Within the Numbers.
The Story and the Prediction
When you step back and view the four teams together, clear identities begin to emerge.
- Boston is built around physicality and defensive control, relying on structure and goaltending to win tight games.
- Minnesota is the offensive engine, generating scoring opportunities at a high rate and distributing production across multiple players.
- Montreal is the complete system, combining defensive discipline, efficient scoring, and elite goaltending.
- Ottawa is the pressure team, creating chances and playing with intensity, but struggling to convert consistently.
The playoffs ultimately test how teams respond when their primary strength is neutralized. If Minnesota’s offense slows down, can their goaltending carry them through low-scoring games? If Ottawa continues to generate chances without converting, can they win against more efficient teams? Boston and Montreal provide more consistent answers to these questions. Boston’s structure and physicality make them well-suited for playoff hockey, allowing them to stay competitive even when scoring is limited. Montreal builds on that foundation with greater balance, combining defensive strength with the ability to finish and the advantage of the best goaltender in the field.
That distinction becomes critical in a potential final matchup. Over the course of a series, the ability to control games, limit mistakes, and rely on goaltending tends to outweigh pure offensive output. Montreal checks all of those boxes. They don’t need high-scoring games to win, and they are less vulnerable when conditions become difficult. Their advantages are not explosive, but they are consistent – and consistency is what wins playoff series.
The data points toward a final between Boston and Montreal, two teams built for the demands of playoff hockey. And while it may not seem like it, in that matchup we believe Montreal holds the edge. They combine structure with finishing ability and elite goaltending, giving them multiple paths to victory.
Want to see more sports stories? Explore the projects and sports stories published on Stories.
Final Take
The Walter Cup won’t be decided by the most explosive offense or the biggest individual performance. It will be won by the team that can defend under pressure, step up their physical game, convert limited opportunities, and rely on goaltending when the margins are thin. Among the four playoff teams, Montreal stands out as the most complete in those areas.

Our prediction: Montreal over Boston.