
Within the Numbers Series # 4
Introduction
Every year, the NHL culminates in the playoffs, a grueling battle for the Stanley Cup. The pace is faster. The hits come way harder. And the game can shift in a matter of seconds – Game 1 in the Buffalo and Boston matchup is a case in point. So, the question is how can you spot a potential Stanley Cup winner among all of the matchups underway?
To answer this question, we'll explore the Team Balance Index and two different ways to evaluate teams using their TBI using a heatmap and a radar chart. Yeah, we're going to nerd out a little bit on the visualizations, but it's a useful place to start when sorting through all the stats.
Balance versus Win Percent
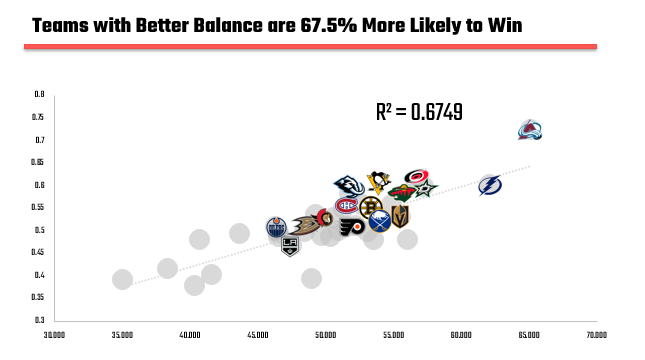
The idea behind the Team Balance Index (Balance for short) is simple: hockey isn’t won in one dimension. Teams that can generate offense, suppress their opponents, keep pucks out of the net, and bring enough physical presence tend to outperform those that bias one area or another. When we map Balance against Win Percent, the relationship is clear: more complete teams win more often. For example, the following scatter chart (using data from the full 2025-2026 season) shows a strong, positive relationship between Balance and Win Percent. That is, higher-scoring balanced moves in the same direction as a team's likelihood to win. The teams that made the 2026 NHL playoffs are highlighted using their logos.
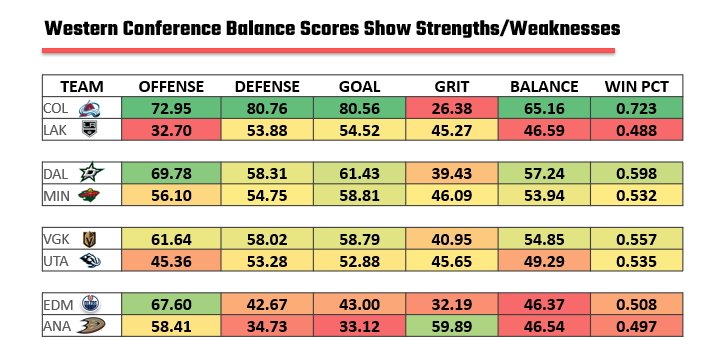
When we bring that lens into the playoffs, where matchups tighten and weaknesses get exposed quickly, balance becomes even more important. For example, the following Balance heatmap illustrates where Western Conference teams are strong and challenged. In this model, the Avs, albeit one of the Cup contenders, shows an area of weakness in Grit. They also, though, have the highest Balance (65.16%) and Win Percent (72.3%) in the conference.
In case you're wondering how the Eastern Conference compares on TBI, you can see the following heatmap with all of the matchups currently in play. Tampa Bay and Carolina emerge as two of the stronger teams based purely on TBI and Win Percent.
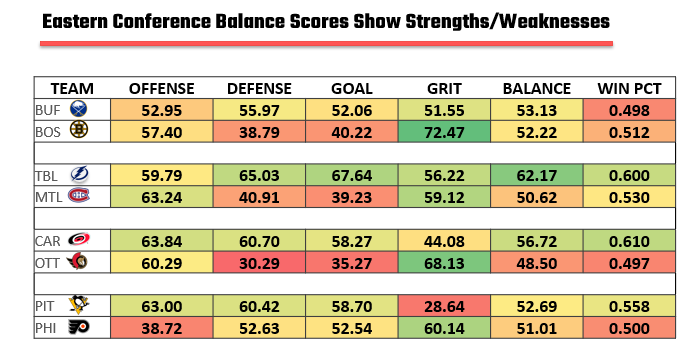
We like using TBI as a way to compare teams at the summary level; it's directional but gives you an analytical starting place when looking for strengths or weaknesses to explore.
Interested in taking one of our live workshops on Sports, AI and Storytelling? Then check out our Offerings page.
What is a Radar Chart?
While heatmaps are a good summary view, there's also the radar (or spider) chart, which is a good way to compare two teams across multiple variables – such as the constituent components of the Team Balance Index.
In this sense, a radar chart is a clean way to visualize how a team is built and compares to other teams. Instead of looking at columns of numbers, you map each metric—Offense, Defense, Goaltending, and Grit—onto its own axis, all radiating out from a central point. When you connect those points, you get a shape. That shape tells a story; that is, a well-balanced team looks like a full, rounded polygon, filling out the chart evenly. A flawed or specialized team looks jagged, spiking in some areas and collapsing in others. In hockey terms, it’s the difference between a team that can win in multiple ways and one that needs the game to go a very specific way.
If you take Colorado and Los Angeles and plot the Team Balance Index on a radar chart, you quickly see where the two teams differ and by how much. For example, you can see that the Avs are stronger on offense, defense and goaltending, but less so on their physical game.
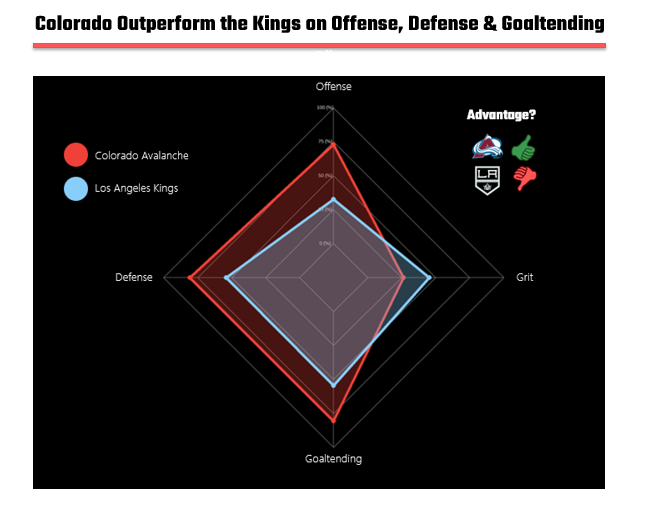
And that’s where radar charts become powerful—not just as a visual, but as a storytelling tool. When you overlay Colorado and Los Angeles, you don’t just see two teams; you see two philosophies. Colorado’s chart almost engulfs Los Angeles across offense, defense, and goaltending. The only place the Kings push back is in grit, where they hold an edge. But grit alone doesn’t expand the overall shape enough to compensate for the gaps elsewhere.
What this reveals is how the game is likely to be played. Colorado’s advantage in offense suggests sustained pressure and scoring opportunities. Their defensive and goaltending strength means they can suppress chances going the other way. Los Angeles, by contrast, needs to tilt the game into a more physical, grinding style, one where that grit axis actually matters. If the game opens up, the radar chart tells you who benefits. If it tightens into a battle along the boards and in front of the net, Los Angeles has a path.
Now is this predictive? No, this data represents a summary of the 2025-2026 NHL season, so it's a summary view of the season as a current snapshot. So, it's the starting point to evaluate how these two teams compare and could play against one another. The playoffs are a step up in pace from the regular season, but that notwithstanding we don't believe that the Kings will overcome the Avs in this round.
As a comparison, let's look at Dallas and Minnesota, who, except for offense, have pretty similar profiles. And it's these types of margins that in the playoffs tend to get really tight, really quick. So, while we've marked Dallas as having the advantage, we've also marked this matchup as being in "Coin Flip Territory."
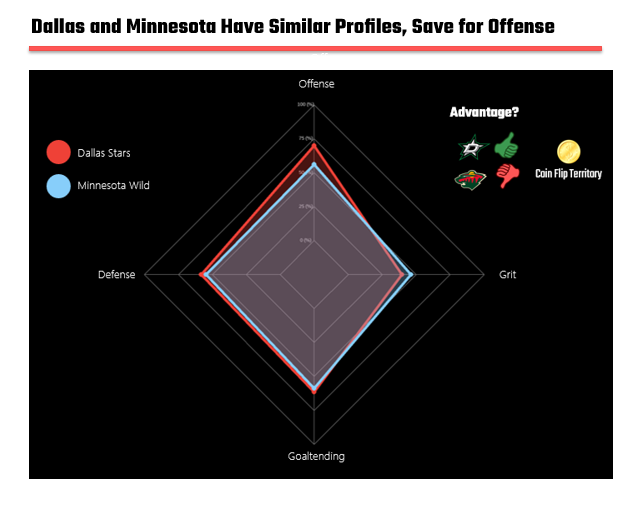
This is the underlying insight: radar charts don’t just compare teams; they expose how they win. Colorado wins by being better almost everywhere. Los Angeles wins by dragging opponents into a different type of game. And in a playoff series, where adjustments happen quickly and weaknesses get targeted relentlessly, that difference in shape often becomes the difference in outcome.
Check out our Instagram site for more NHL coverage in the regular series entitled Within the Numbers.
Finding the Narrative in this Data Story
We've said this before, but it bears repeating: explore the stats through a summary view (current snapshot), historical view (trending) and future view (predictive model/forecast). Within these views, you will find an insight – something that gives you signal to a story. From there, use your knowledge of the sport, the team or the playoffs to weave your story.
Game on!

