
Within the Numbers # 11
We built a predictive model using league-adjusted point production, age and a range of competitive signals, which flagged 61 prospects as potential top picks. Interestingly, when using league-adjusted production as a key variable, it re-ranked the draft prospects moving more Scandanavian players into sleeper prospect category. Hidden prospect pipeline or mathematical mishap?
Welcome to the 2026 NHL Draft
Each year, Elite Prospects (EP) publishes a Draft Guide that is absolutely chock full of prospect statistics, rankings and scouting notes. The 2026 NHL Draft Guide was recently released and does not disappoint. Using this guide, you begin to see how scouts bring together views of a player being considered in the 2026 NHL Draft, both qualitatively and quantitatively.
A More Global Talent Pool
The NHL is evolving by becoming a more global league. For example, while it's historically relied heavily on North America, this year's top prospects are increasingly from Europe (especially Sweden, Finland and Czechia) – a consistent trend we've been seeing over the last few years. This means more talent from a wider set of regions, leagues and development systems.
Because our goal was to find sleeper prospects, we started by sampling the top prospects (forwards) from this international cohort and pivoted point production against league strength using the NHLe metric (more on this later). The result was the below scatter plot, which calls out the top ten potential sleepers in this year's draft by name.
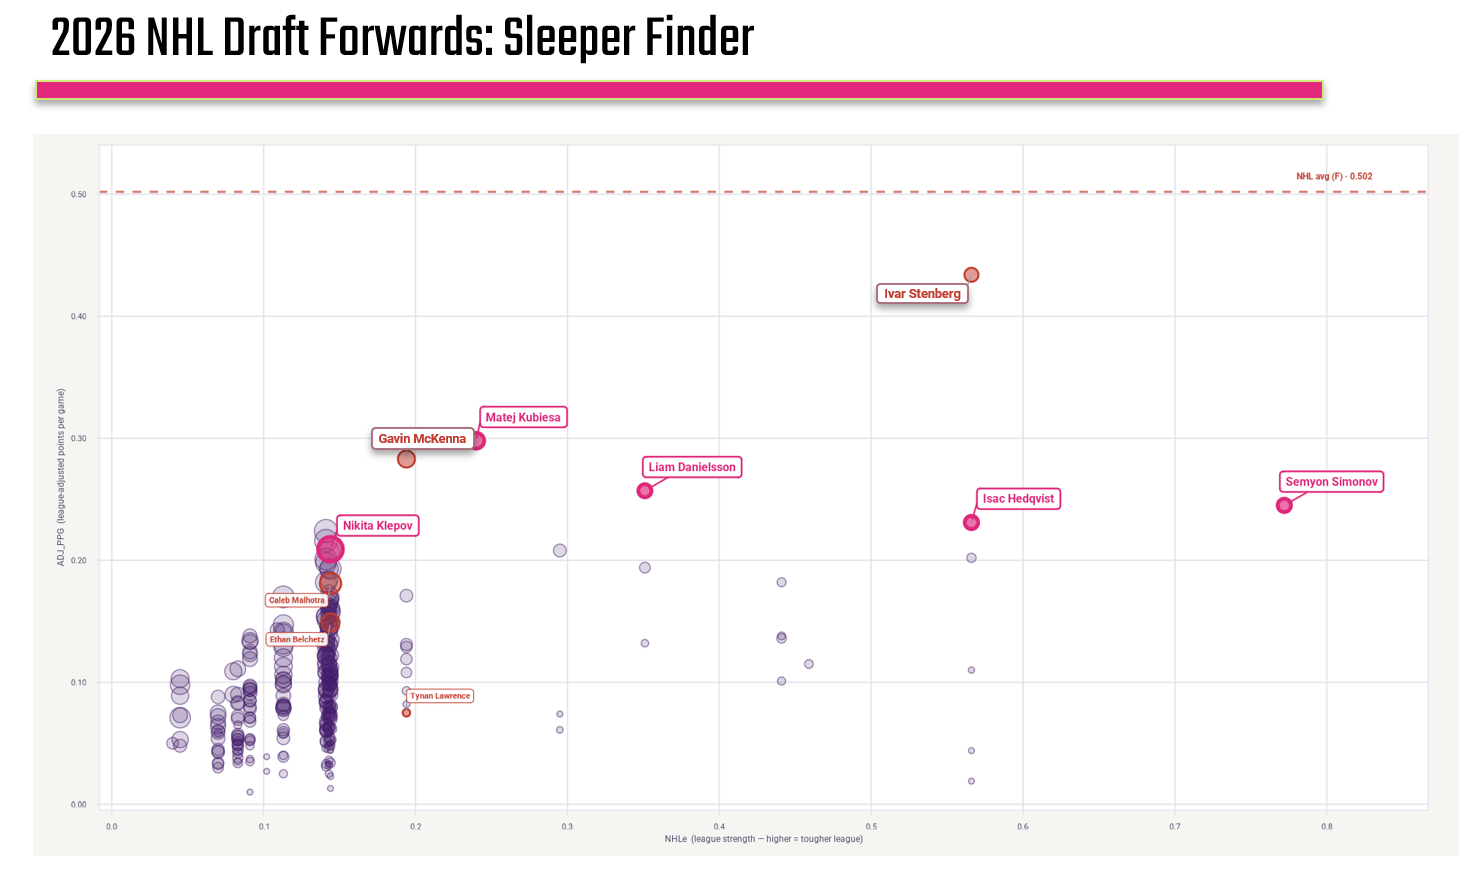
This is less predictive model and more analysis, but it's instructive in that by integrating league-adjusted production, you begin to surface prospects that may be further down the ranking. Maybe unsurprisingly, 40% of the top ten were Canadian players. Surprisingly, 30% of them were Swedish players. We wanted to test this further, so we continued with the model-building process.
Building a Predictive Model
As a formal model-building exercise we took EP's top prospect list to see if we could find additional signal on otherwise down-ranked prospects. To do this, we curated five years of NHL prospect data and built a predictive model to explore the gaps between this year's scouting reports and the math to see if AI could do a little prospect gold-mining for us.
We ran a sample of the top draft-eligible prospects through a logistic regression model built on the aforementioned five seasons of historical draft data. We used league-adjusted point production, age, games and tournaments played (experience), and year-over-year improvement as inputs into the model and asked it a simple question: which players in this class show the statistical profile of a typical Rounds 1–2 selection? In short, we wanted to see if we could find any distinguishing features for NHL prospects that are more likely to see them be drafted in the first two rounds.
The answer surprised us. And it will probably surprise you too.
Check out our Instagram site for more sports coverage on the weekly series entitled Within the Numbers.
How the DPM Model Works
One of the underlying assumptions behind the model is simple, but critical: not all points are created equal. This means that a goal scored in the OHL is worth roughly 0.144 goals scored in the NHL – so you need about seven OHL goals to equal one NHL goal. There's a statistical analogy for every league, but there's a useful transformer metric called the NHL Equivalency metric (or NHLe). Thus, where the NHLe for the OHL is 0.144, the NHLe for the Swedish Hockey League (SHL) is 0.566 and Liiga (Finland's top pro league) is 0.441.
Just across these three leagues (i.e., the OHL, SHL and Liiga), there is a significant difference of play even though they are all strong leagues. And yet one might argue that players in the tougher European leagues are undervalued relative to their OHL peers because the raw point totals look modest. However, our model tries to correct for this (which at the same time introduces an inherent bias towards stronger leagues). It takes a prospect's raw production, multiplies it by their league's NHLe translation factor, and normalizes the result into a predicted probability of being selected in the first two rounds. A score above 0.25 triggers a flag. Of the sample of players we scored, 61 crossed that threshold.
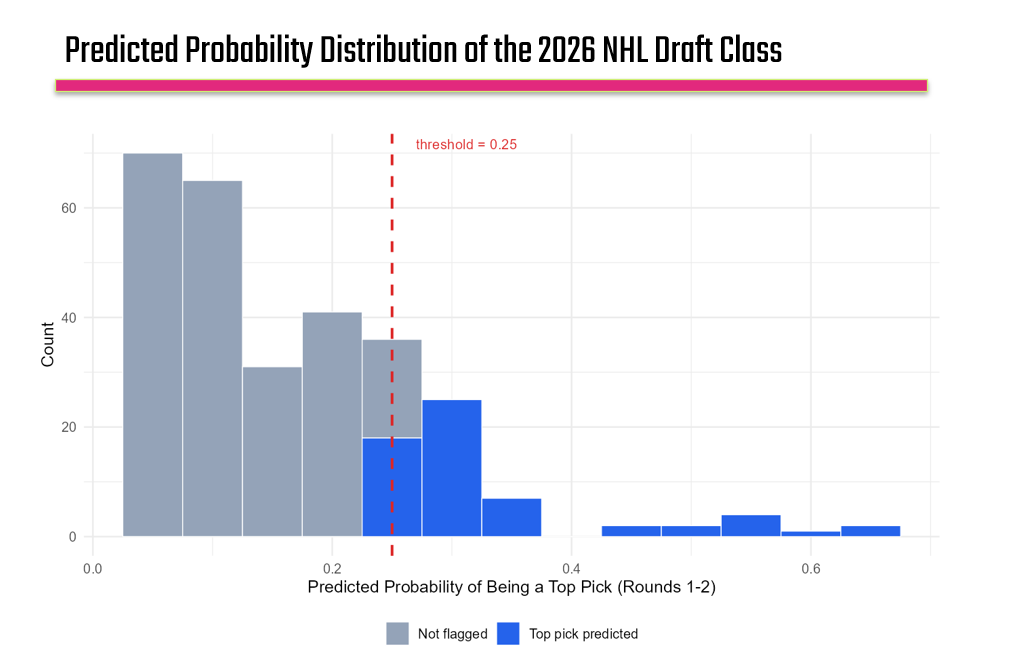
The way to read this visualization is that the columns that are wholly or partially colored blue are the prospects who were discovered by our model. Around the 0.25 mark you see a cluster of prospects, but towards the right tail of the distribution is where things get interesting. That is, the majority of the class clusters below 0.20, which are modest scores for players the model regards as long shots for the top 64 picks. But the right tail shows a cluster of players who score above 0.45, suggesting not just "maybe a top pick" but "high probability of a top pick."
We love outliers, so let's dig into our findings.
Want to see more sports stories? Explore the projects and sports stories published on Stories.
Age & Tournament Participation as Additional Signal
Before we get to specific players, we should mention a significant finding in draft analytics research: younger players at draft day are systematically better long-term bets than older ones, even when their raw stats are identical. This is not necessarily a new idea in baseball sabermetrics or basketball analytics, but it has been a bit slower to take hold in hockey. The density plot below brings the point home.
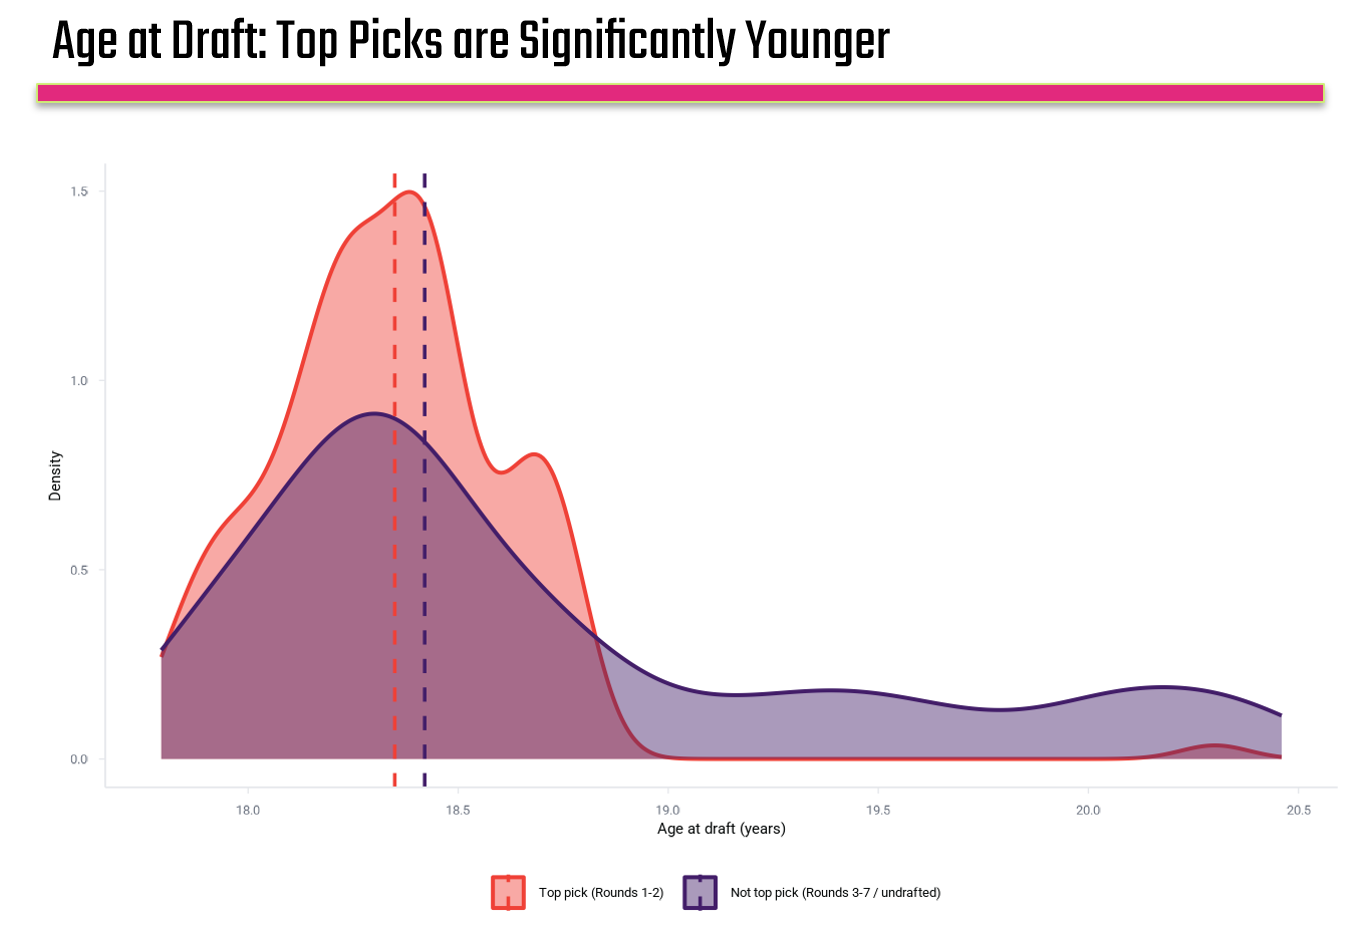
The red distribution (the top picks) is a sharp, steep spike at 18.3 years. The purple distribution (everyone else) is flat, wide, and trails all the way to 20.5. In other words, if you're drafting in Round 1 based on "who's producing the most right now," you'll systematically favour players who are old for the draft, mature earlier, and have less development ceiling ahead of them.
Our model weights age accordingly. So, a player who is 17.8 years old on draft day and posts a 0.20 Adjusted Points per Game in the SHL looks very different to the model than a 19.5-year-old posting the same number. The young player is already doing it against men, and the older player should be.
While age is a contributing factor, we need to also call out a limitation: the model repeatedly runs into the absence of tournament performance data for many European prospects. Tournaments like the U18 Worlds, the World Juniors, and the Hlinka Gretzky Cup are often where scouts' perception of a player crystallizes and they provide a different competitive context than regular-season stats. It's also where players gain invaluable experience on the world stage. The density comparison below shows the gap between career and tournament Adjusted Points per Game for historical top picks.
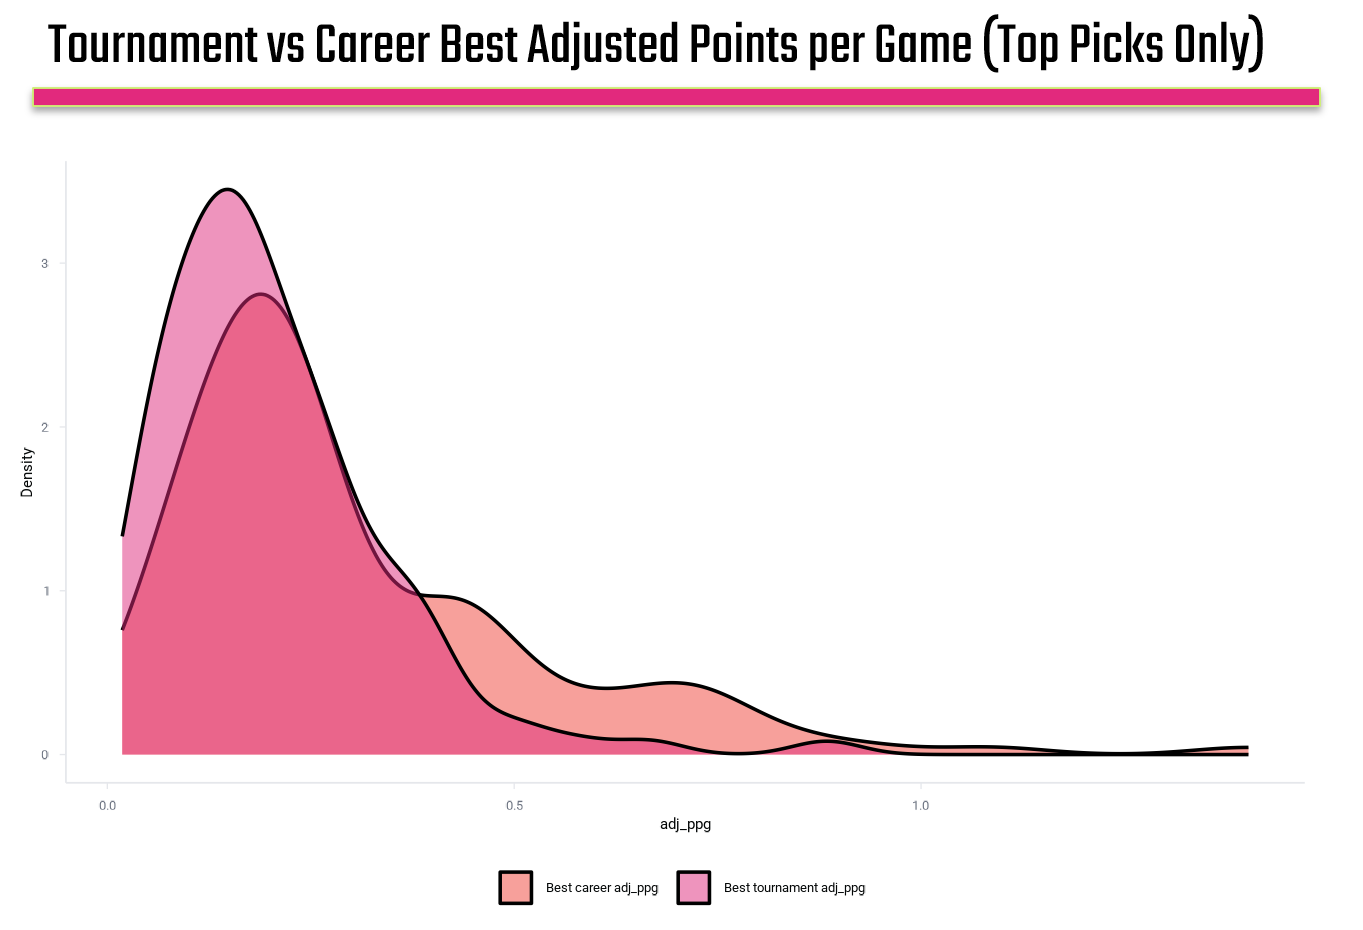
The pink distribution (tournament Adjusted Points per Game) peaks lower and tighter than the red (career best). This is expected — tournaments are short-sample events against the world's best young players. But players who exceed their career numbers in tournaments — like Hermansson, who posted 1.71 Points per Game internationally on an NHLe-adjusted basis — are sending an unusually strong signal. When the model and the tournament data point in the same direction, confidence should rise. When the model flags a player with no tournament data (e.g., the Slovakia cluster and several Russian prospects), treat the flag with appropriate skepticism.
Interested in taking one of our live workshops on Sports, AI and Storytelling? Then check out our Offerings page.
The Scandinavian Phenomenon
We've been tracking the incoming Swedish talent for some time now and are very bullish on Ivar Stenberg going first overall in the draft. But he's one indicator of a regional phenomenon that is beginning to take hold of the NHL that is also evidenced by our model. That is, when we apply the league-adjusted production metric and sort the model's output by predicted probability, the top of the list is not populated by OHL stars and NCAA point machines. It is dominated by teenagers playing professional hockey in Sweden and Finland.
For example:
- William Sörbrand, a 6-foot-4, 209-pound centre who played limited SHL minutes this season, tops the model at a predicted probability of 0.667.
- Viggo Björck, who lit up the World Juniors and secured a first-line role at Djurgården late in the season, scores second at 0.651.
- Elton Hermansson, a winger playing in HockeyAllsvenskan (the Swedish second division, NHLe 0.351), comes in third at 0.615.
- Oliver Suvanto, a 6-foot-3 Finnish centre who leaped directly from the U18 level to full-time Liiga minutes, scores sixth at 0.530.
None of these players are neccesarily obscure on the consensus board; Björck and Stenberg are widely expected to go in the top 10. But the model's ordering is different from EP's, and for us the gap is intriguing and worth exploring.
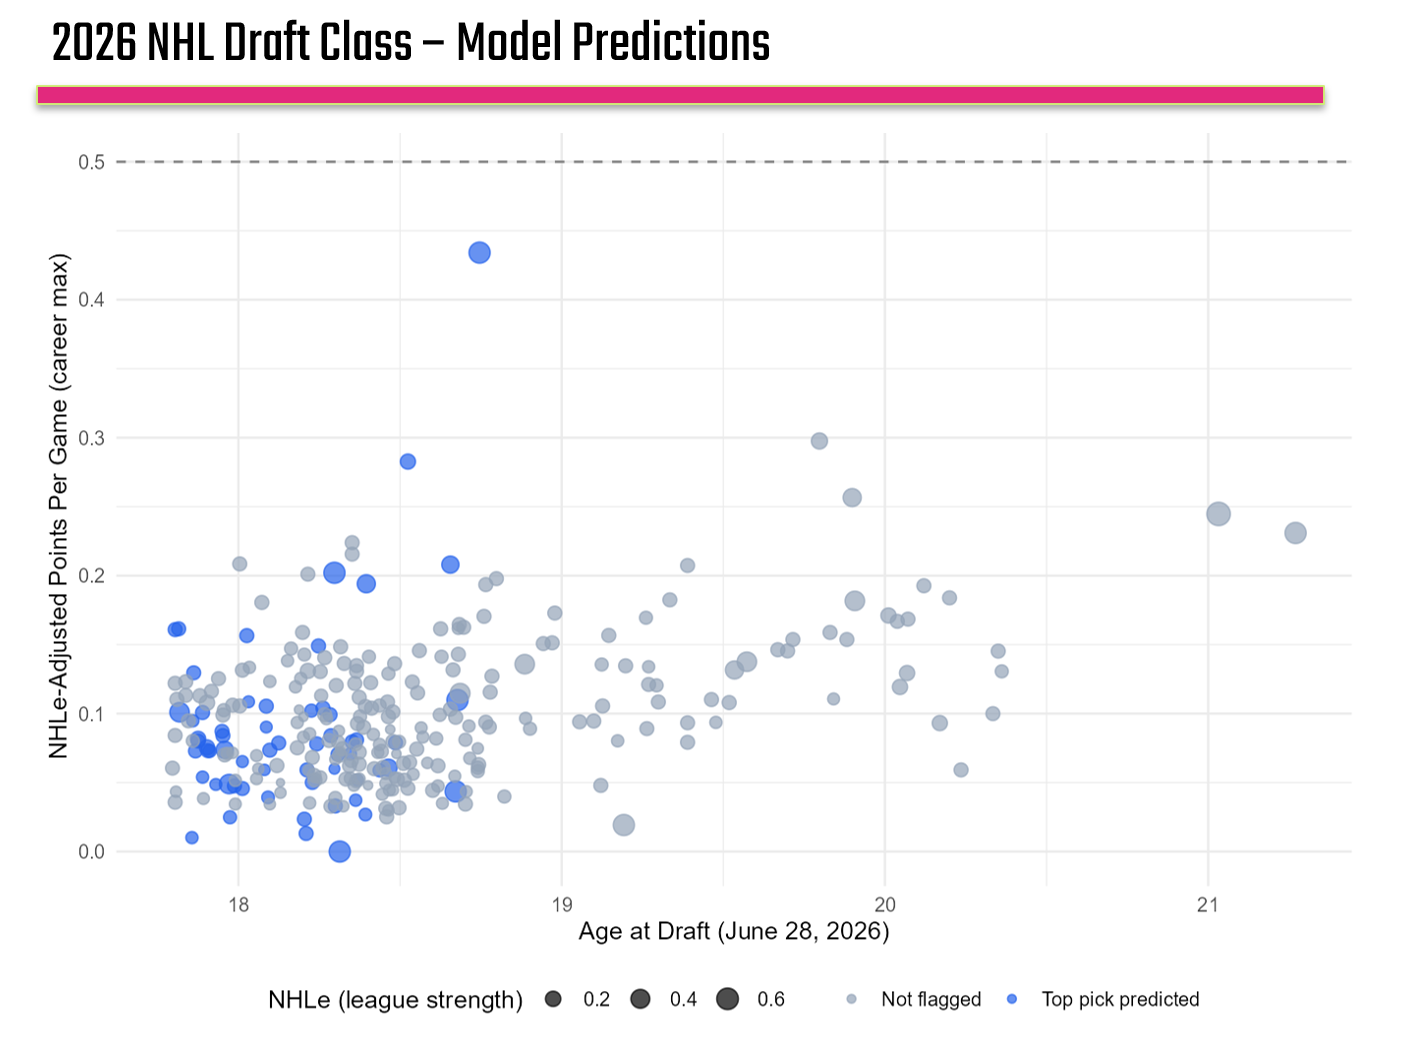
The scatter plot tells the core story visually. The flagged players (blue) are not exclusively the highest producers. Many of them sit at modest Adjusted Points per Game levels. What distinguishes them is the size of their bubble (their NHLe) and their position on the age axis. Right or wrong, the model is rewarding players who are young and playing hard schedules, not just players who are racking up points in friendlier environments.
Check out our Living Course page, where we regularly post modules teaching you about Sports, AI and Storytelling.
The Three Players on our Watch List
But, let's get more specific. Here are three model-flagged prospects where the data and the scouting community either agree for different reasons, or disagree outright and why both perspectives matter.
Elton Hermansson
RW/LW, HockeyAllsvenskan (Model #3, EP #25)
Hermansson's raw stats are 11G–10A–21PTS across 38 games in HockeyAllsvenskan. That's only the fourth-best mark among all U18 players in that league's history, behind former top prospects including Dalibor Dvorský and Jesper Bratt. His 33 points across 18 international appearances with Sweden U18 put him in rarefied company; William Nylander is the only player in the past 30 years to exceed his 1.8 PPG pace in a single season for the program.
According to the Elite Prospects NHL Draft Guide 2026 on Elton Hermansson:
"Looking for a high upside forward bet in the second half of the first round? Elton Hermansson could be just what the doctor ordered... He dominates the puck, consistently able to drive play and create quality chances for himself through his superior elusiveness and handling abilities."
EP Grade: A · Rank: 25 · Shades Of André Burakovsky
Here, the model and EP are in agreement on the player; they just reach the conclusion differently. EP's scouts watched him move through defenders and logged it as "ankle breaker" and "evasive." The model sees a 18.4-year-old posting 0.194 Adjusted Points per Game in a league with 0.351 NHLe and flags it as a profile consistent with a late first-round pick.
Oliver Suvanto
C, Liiga (Model #6, EP #28)
Suvanto's case is one of the more compelling in the class. He posted 48 games at the Liiga level as a 17-year-old, which is rare. His raw production (2G–9A–11PTS) looks thin on paper. His Adjusted Points per Game of 0.101 is modest. But the model is not looking at that number in isolation; it is looking at a player nearly two years younger than the league average, holding down professional minutes in a league that translates at 0.441 to the NHL.
According to the Elite Prospects NHL Draft Guide 2026 on Oliver Suvanto:
"Oliver Suvanto's power forward game is one of the very best in the draft class... He meticulously keeps track of his assignments, rotates around to offer support where needed, and always hustles back hard... In this regard, he's the closest thing to Anton Lundell to come out of Finland in the past six years."
EP Grade: A · Rank: 28 · Shades Of Jordan Staal, Adam Lowry
The model's 0.530 probability is higher than what EP's rank (28th) might imply. The delta might come from how each system weights floor versus ceiling. If EP's scouts are calibrated for NHL impact, then they may see the limited scoring and mark down the upside. The model, however, sees the age, the league, and the games played, and treats those as reliable forward indicators.
Michal Jakubec
F, Slovakia (Model #7, EP: unranked in top 50)
This is where the disagreement gets interesting. Jakubec scores at a model probability of 0.529, seventh in the entire class. EP's scouts are considerably more skeptical, flagging his limited NHL-projectable skill set as a concern. "Our biggest question: Does Jakubec have more in him? Based on our viewings, he might not," the guide notes. The model doesn't watch film. It sees a 17.96-year-old, Adjusted Points per Game of 0.074, NHLe context at 0.295, and tournament performance that is missing entirely from this dataset and flagged with no tournament data across most Slovakian prospects. The model's enthusiasm here may reflect a data gap more than a genuine signal, and that's important to call out.
According to Elite Prospects NHL Draft Guide 2026 on Michal Jakubec:
"Jakubec's upside comes from his high-energy style. He plays with consistent intensity, contributing on the forecheck and backcheck... his puck skills project as below average at the NHL level. With that said, he could be just skilled enough to make it work."
EP: Not ranked in top 50 · noted for U18 World Championship performance
Have a young athlete in your family? Want to give them a development framework to go from prospect to pro? Check out our You, Inc. framework and get your self-assessment and report for free!
The Verdict
The model and the scouts don't always agree. When they do agree, for example, Viggo Björck, Ivar Stenberg, and Elton Hermansson, the case for those players is exceptionally strong. When they disagree, perhaps we should explore it more to see if there's any merit to the design in the math.
Take, for example, Noel Pakarinen. He's #83 on EP's board but #4 on the model, so represents a significant gap. The model sees a 17.97-year-old playing in Liiga, a league with an NHLe of 0.441, and assigns him the profile of a Rounds 1–2 pick. EP's scouts grade him C as a potential bottom-six NHLer with a good shot and limited playmaking. There's tension here and a predictive model in this sense should not be seen as a substitute for a scout.
In our case, there's a deliberate bias in the math: youth and the strength of the league in which the prospect plays. This means all production is not treated equally, and the math gets hyper-focused yet the scout remains objective across multiple dimensions. This translates into our our model trying to answer a more pointy question where scouting looks multi-dimensional – it's important to remember this.
What this article is really about is not any individual player. It's about how to use data to ask better questions. The model doesn't watch film. It doesn't know that Sörbrand only played 5 games, or that Jakubec may not have more in him. But it also may not have blind spots about geography, about raw point totals, or about whether a player "looks the part." Used together, models and scouting are far more powerful than either alone.

