
WITHIN THE NUMBERS # 28
Introduction
Every week we track the Team Balance Index (TBI), the average of four composite scores: offense (OFF), defense (DEF), goaltending (GOAL) and grit (GRIT). We then take the weighted average for the TBI metric. The idea behind TBI is a summary metric that represents key performance areas for an NHL team. You can both gauge where is team is strong or weak and use it as a starting point for a secondary analysis.
Fifty is generally the league average. In this post, we'll cover who moved, what sits under Montreal’s jump, which of its players are producing, and what the numbers say about where the team goes next.
Who's Rising? Who's Falling?
The Habs led all risers, climbing 10.27 points from 41.15 on October 22 to 51.42 on October 29. Calgary Flames followed at +7.68, Minnesota Wild at +6.40, San Jose at +5.38 and the Devils at +4.78. On the way down, Vancouver fell furthest at −6.31 (35.36 to 29.05), ahead of the Rangers (−5.41), Tampa Bay (−4.61), Utah (−4.48) and the Jets (−4.10). You can see all 32 NHL teams represented in the chart below – with the Canadiens highlighted in red.
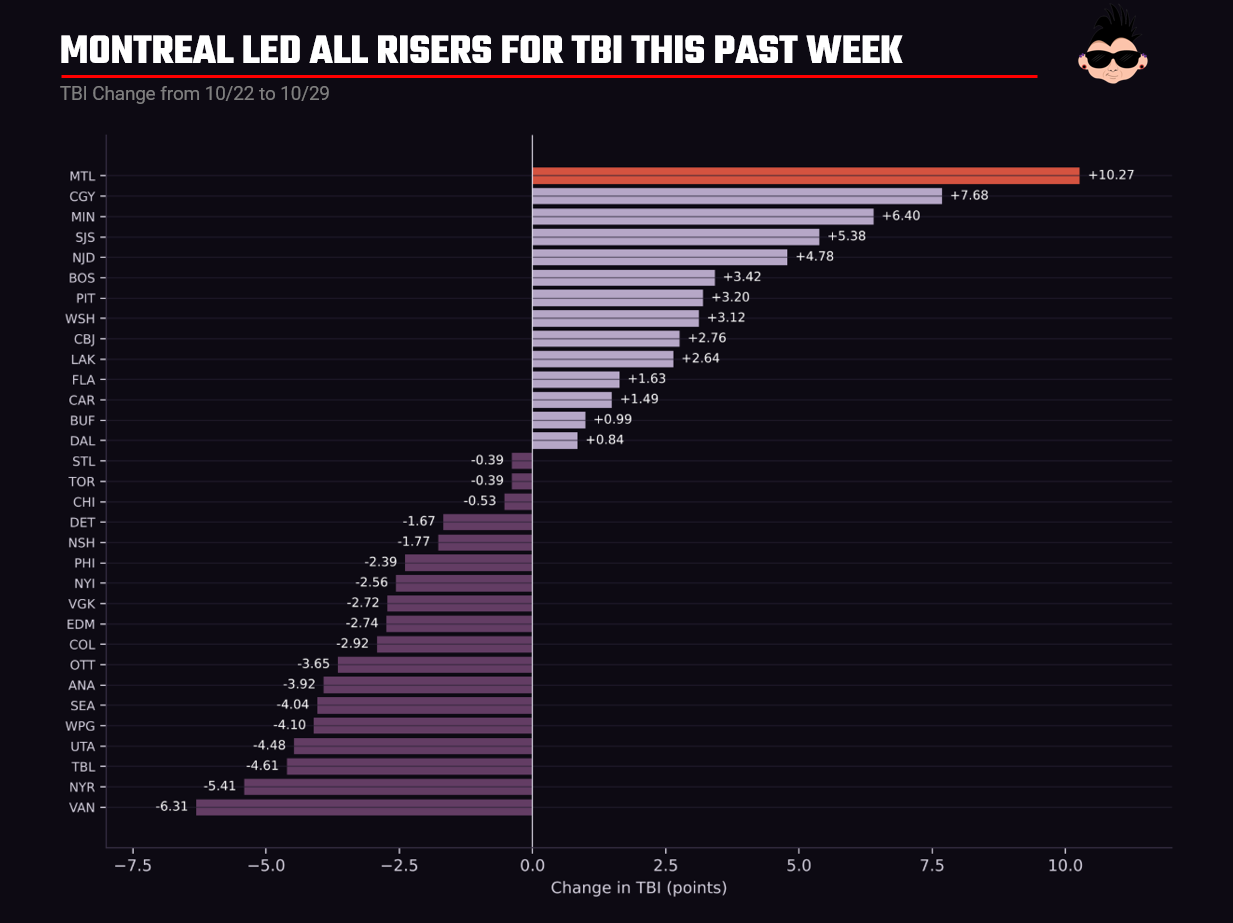
Considering the season to date, the spread between the top and bottom of the league is wide. Boston leads at 66.34 and Vancouver trails at 29.05, a gap of 37.3 points that grew this week. Montreal's gains also come with a higher win profile; that is, its W/L Ratio rose by 1.00 and its (Pythagorean) Win Percentage increased from 0.44 to 0.53. The correlation between TBI and Win Percentage is generally strong (this past week coming in at 79%), which is why a TBI move this large is significant.
Under the Hood: How Montreal's TBI Breaks Down
Montreal’s season-to-date TBI average is 44.6 (shown as BALANCE in the heatmap below), about five points below league average. The components explain why. Grit (50.6) is above average and offense (48.1) is close to it. Defense (40.6) and goaltending (39.3) are well below, and they are what has held the overall score back.
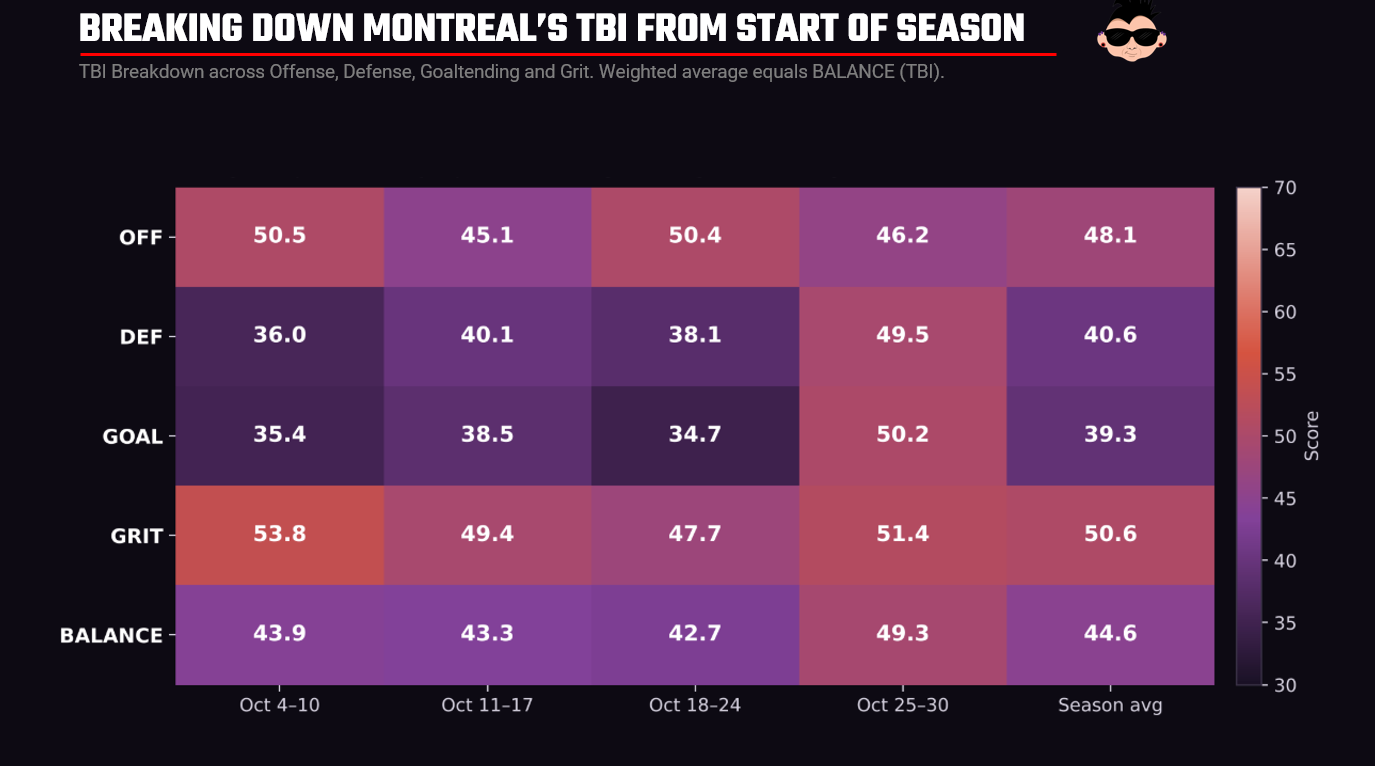
For the first three weeks of the season, the Canadiens' defense (DEF) and goaltending (GOAL) sat between roughly 35 and 40, so the team had one strong half and one weak one. The most recent period, October 25 to 30, changes that picture. DEF rose to 49.5 and GOAL to 50.2, while offense (OFF) dipped to 46.2. This shows that the improvements are coming from the blue line and the crease, which has been underwater. In short, we're seeing the Habs shore up where they were running cold.
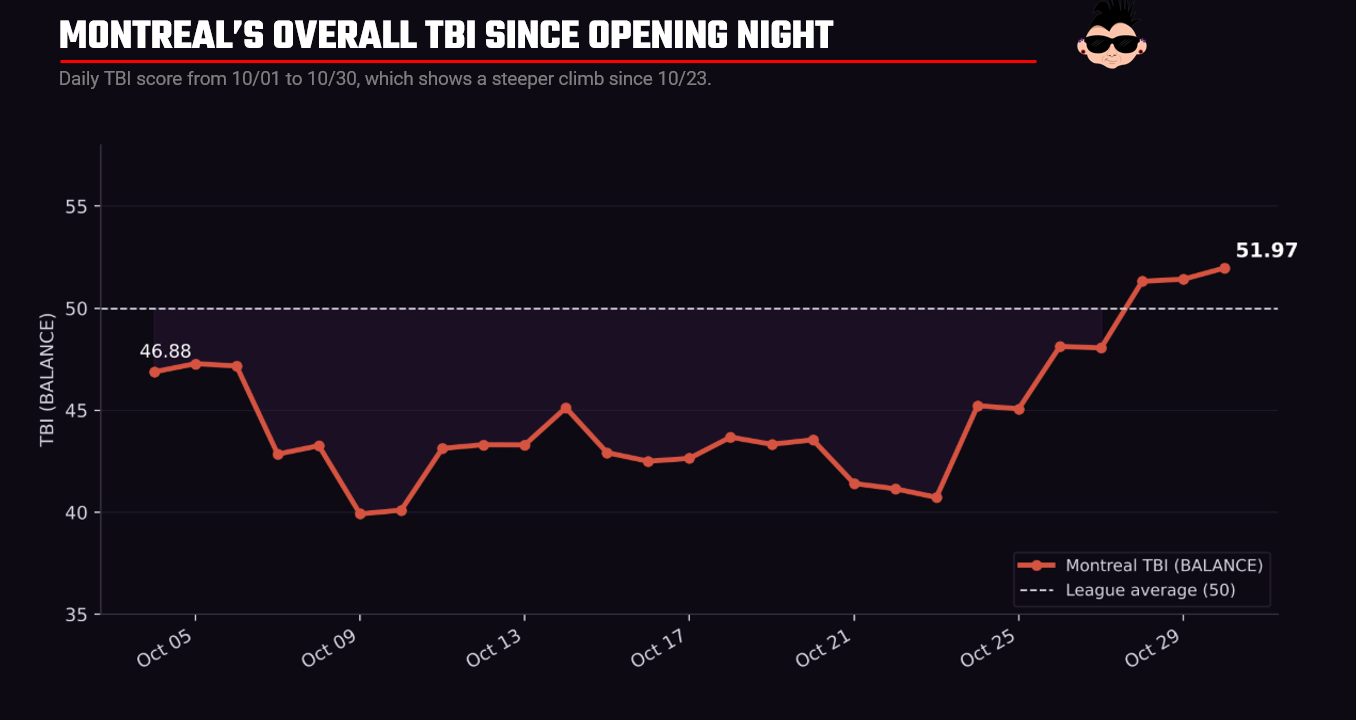
The daily line begins to tell a story about how Montreal are on the rise. TBI bottomed at 39.92 on October 9, spent most of mid-October in the low 40s, and started climbing on October 23. It closed October 30 at 51.97, the highest reading of the season.
The Top Scorers and How They Compare
So, it's great that the Habs are on the rise, but who's contributing and how do they compare with other top scorers?
Montreal’s scoring is spread across the lineup. Nick Suzuki leads at 1.33 points per game (12 points in nine games), followed by Cole Caufield at 0.92 (12 points in 13 games), Lane Hutson at 0.85 from the blue line, Juraj Slafkovsky at 0.69 and Zachary Bolduc at 0.54. You can see these players highlighted in red in the chart below.
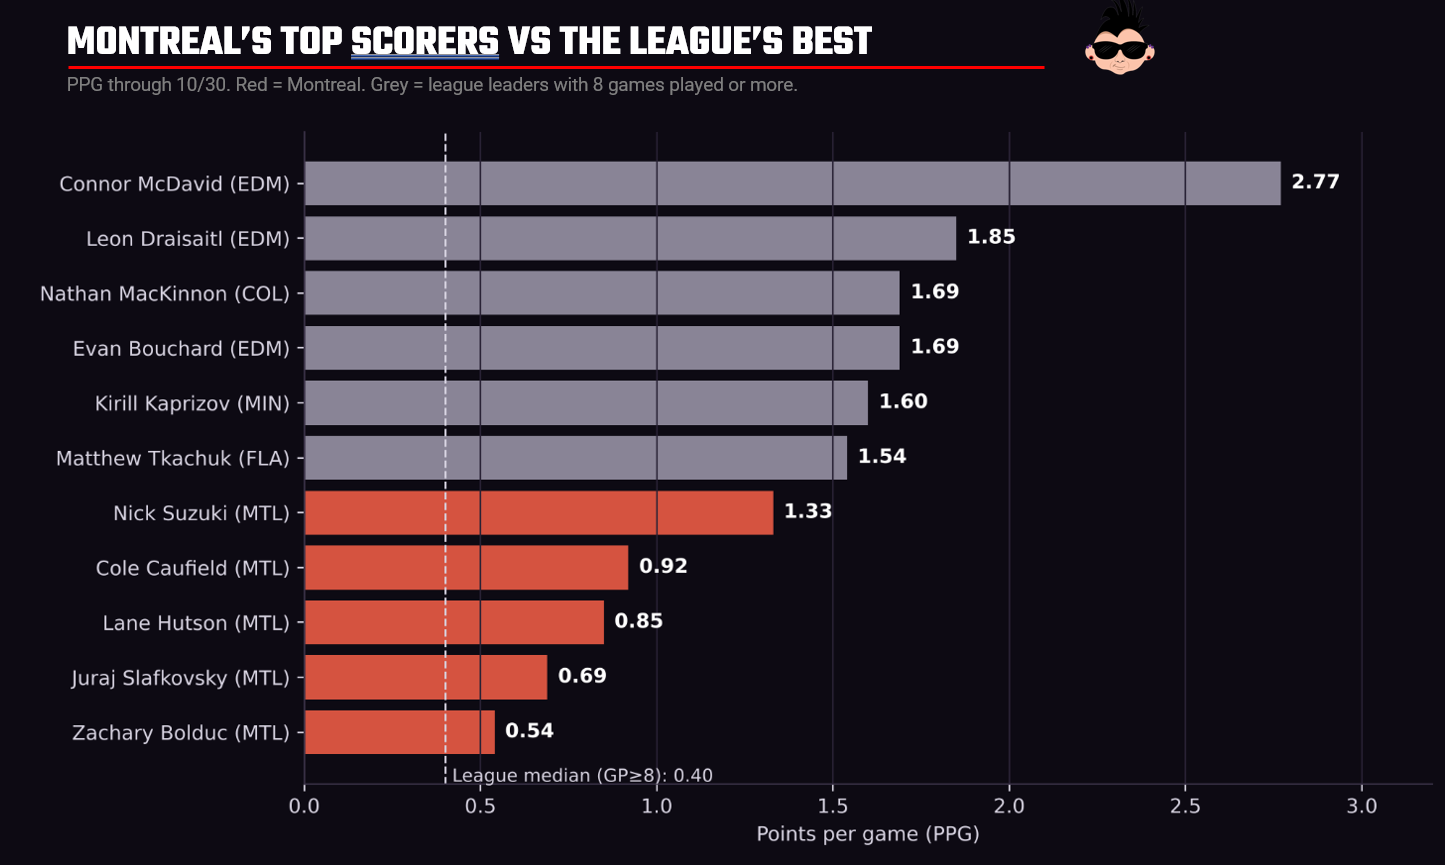
Against the league, those numbers are strong but you can see they're not at the elite level. Connor McDavid sits at 2.77 PPG, Leon Draisaitl at 1.85, and Nathan MacKinnon and Evan Bouchard tie at 1.69. Now, that's not so say they're not above the median production rate. The league median among players with at least eight games is 0.40, so Montreal’s top two are well above typical production. Suzuki is 0.21 points per game behind Matthew Tkachuk’s 1.54.
Prognosis for Montreal: TBI vs Win Percentage
Win Percentage is one of the tests that matter. As we mentioned earlier, across the 32 teams on October 30, TBI tracks Win Percentage closely. What this means is that as TBI increases, so (on average) does the likelihood that a team will win. Said another way, each TBI point is worth about 1.04 points of Win Percentage. Montreal’s TBI of 51.97 maps to a predicted 52%, while its actual Win Percentage is 56%. The results are running slightly ahead of the composite TBI score.
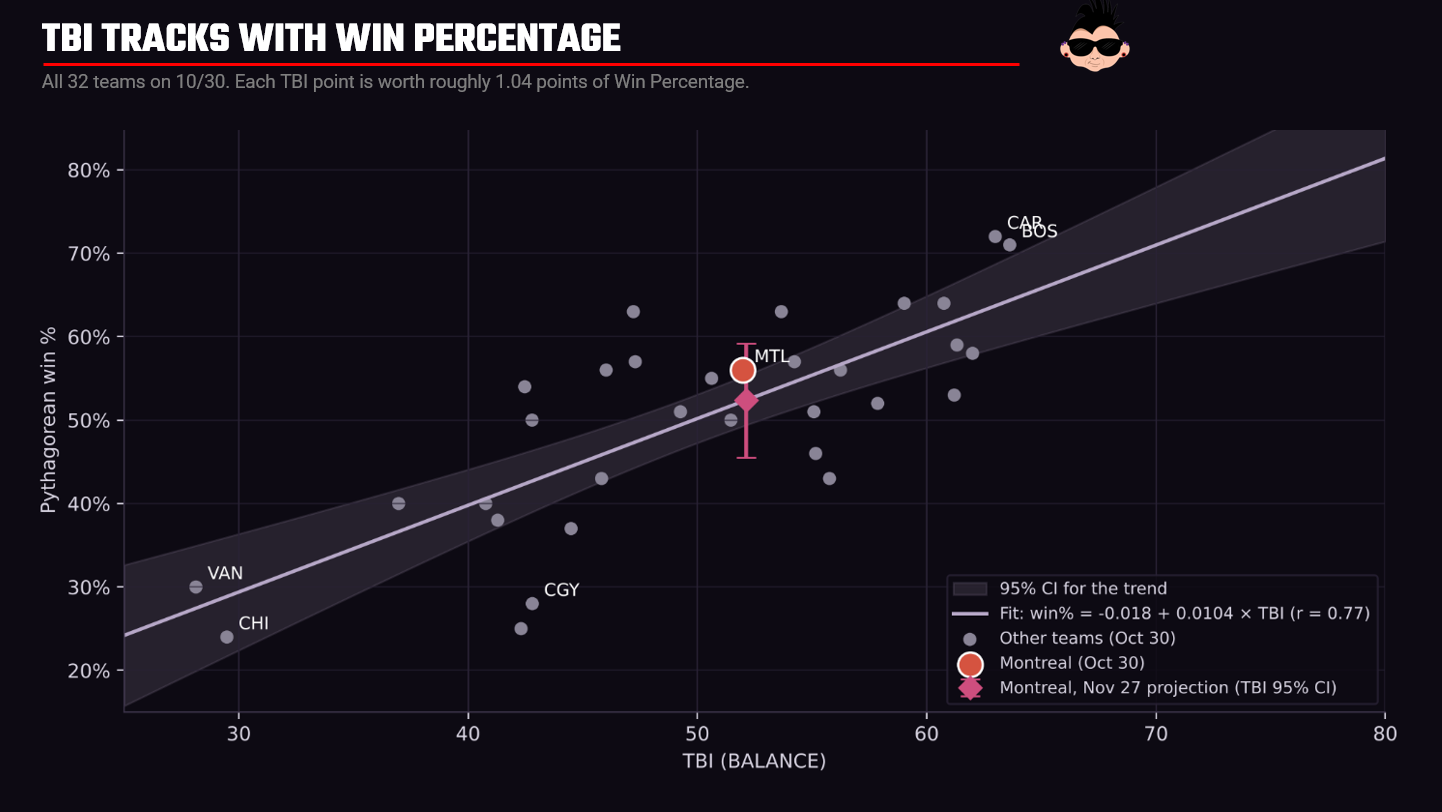
To project out for the next four weeks, we fit a simple linear regression to Montreal’s daily TBI from October 4 to 30. The trend is +1.28 points per week. The fit is weak (R² = 0.19 over 27 days), so read it as directional rather than a forecast. The trend line sits at 47.0 today, below the team’s actual 52.0. That gap matters: the simple trend says the current level is already close to the new baseline, not the start of a steep climb. By November 27 the line reaches 52.1, with a 95% confidence interval of 45.5 to 58.7.
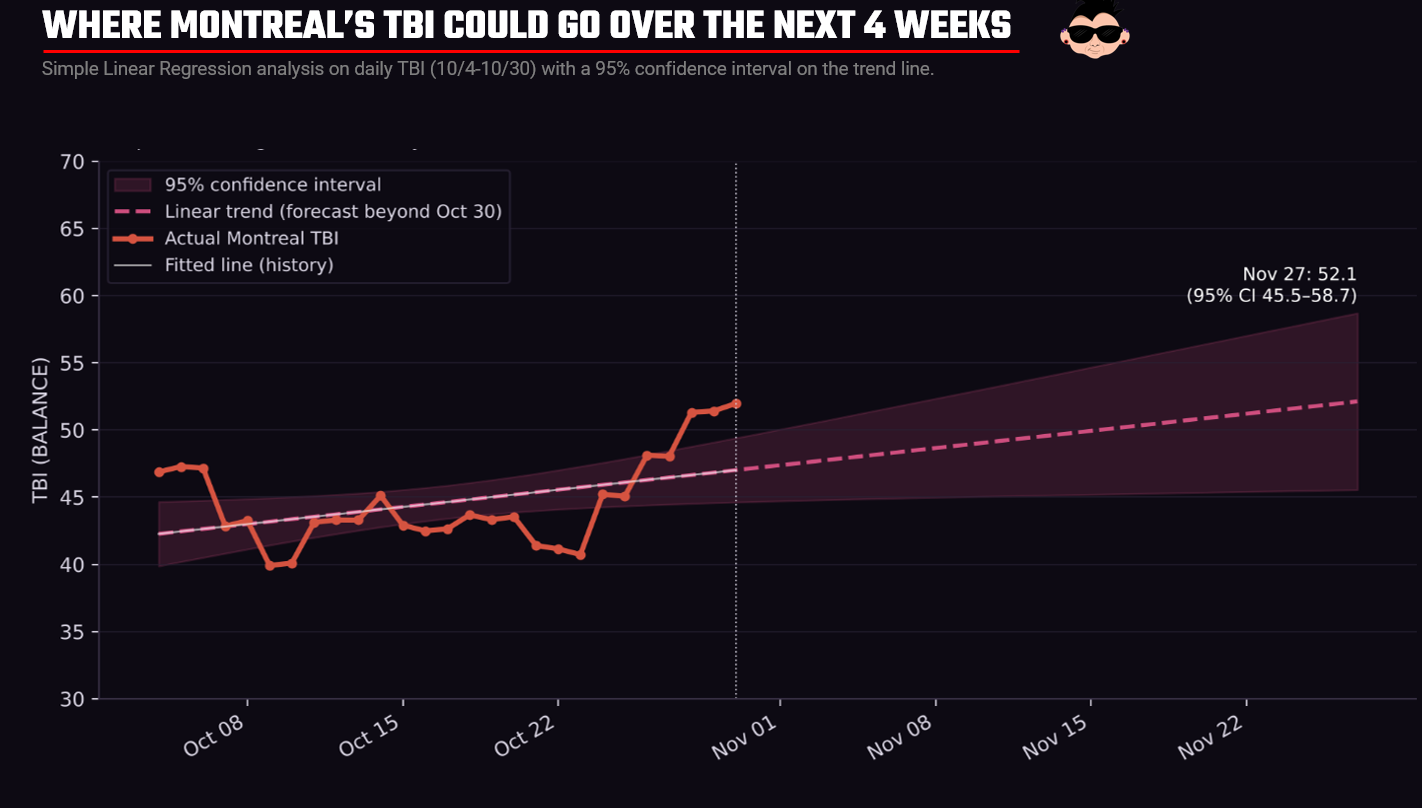
If we look at the win model through the lens of the above regression, that band becomes a Win Percentage of roughly 46% to 59%, with a central estimate of 52%. In plain terms, the base case is a team that holds its current level and plays around .500 to slightly better.
The risk, however, is goaltending. The goaltending score rose from about 33 to 60 in eight days, against a season average of 39.3. Keep offense, defense and grit at their October 30 values and drop goaltending back to its season average, and Montreal’s TBI falls to about 46.9, close to where the team spent most of October. That is the scenario to watch.
The prognosis, then: if goaltending holds, Montreal should stay in the low-to-mid 50s and keep its Win Percentage around the mid-50s. If it regresses, expect a slide back toward the mid-40s. Watch the GOAL row of the heatmap each week; it will tell you more than the headline score.